
Figure 13.
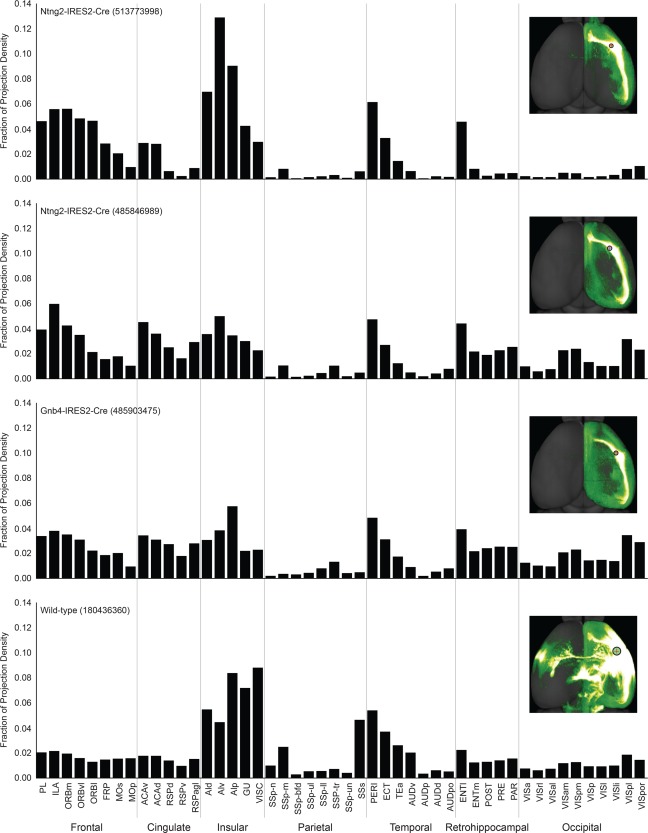
Histograms showing fractions of projection densities from the claustrum to different neocortical and allocortical areas in four AAV‐GFP injection experiments in three Cre mice and one wild‐type mouse. Each inset reveals the location of the injection site and projections in a dorsal view. The four injections are ordered from anterior to posterior.