
Figure 14.
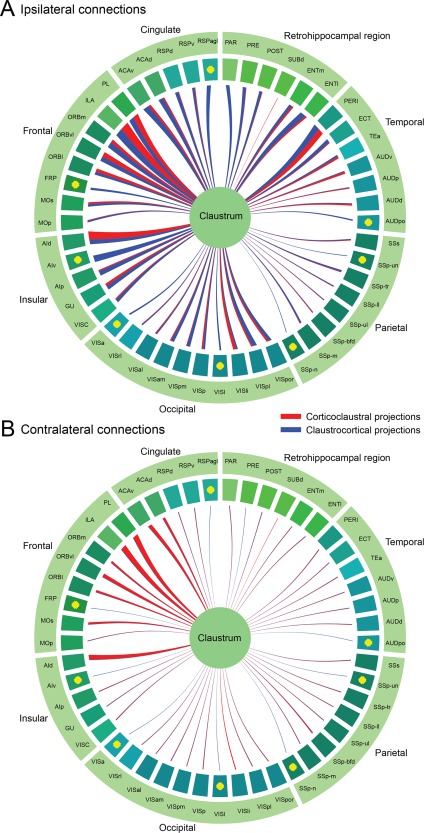
Circle diagrams showing the normalized projection densities from different neocortical and allocortical areas to claustrum and vice versa. A: Ipsilateral connections. B: Contralateral connections. The width of the line is proportional to the normalized projection density. Corticoclaustral projections are color‐coded in red and claustrocortical projections in blue. Yellow dots indicate no injections or lack of good injections. Cortical areas are color‐coded as in the Allen mouse reference atlas.