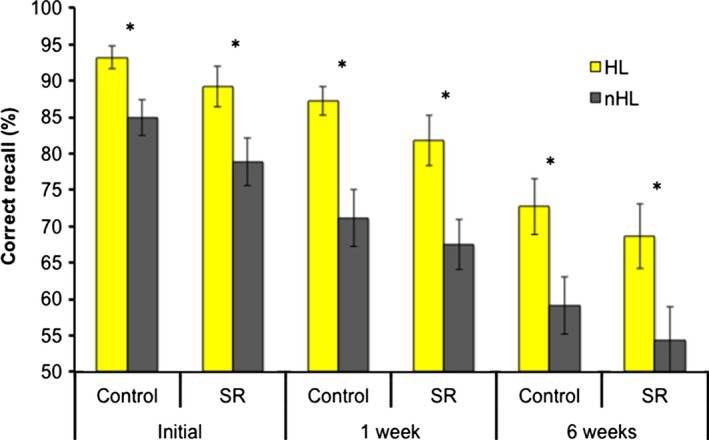
Figure 2.

Free recall performance of the control and sleep restriction (SR) groups. This bar graph shows the mean percentage of highlighted (HL) and non‐highlighted (nHL) idea units that were recalled correctly a few minutes after learning (initial), after the sleep opportunity manipulation period (1 week), and 6 weeks after encoding (6 weeks). Error bars reflect standard error of the mean.
