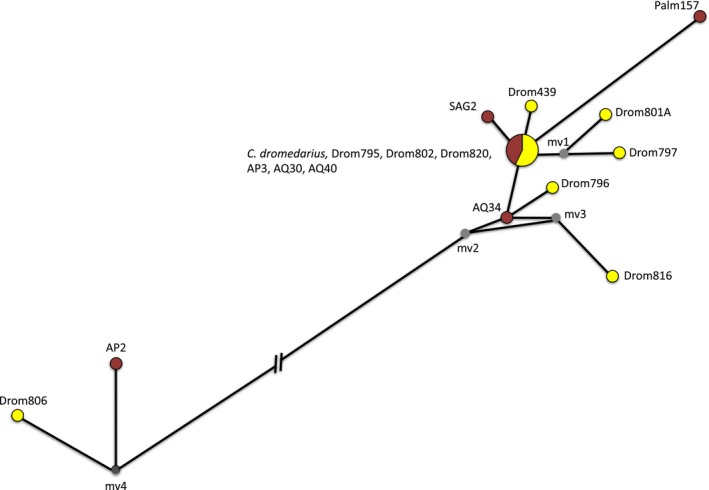
Figure 3.

Representation of the mitochondrial haplotypes (6694 bp) retrieved from 10 modern (yellow) and seven ancient (red) domestic dromedaries. Circles are proportional to the sample size. Small grey circles represent median vectors corresponding to missing haplotypes. The genetic distance of 50 fixed polymorphic sites between two haplogroups is not displayed in the graph and is shown with a discontinuous line. [Colour figure can be viewed at wileyonlinelibrary.com]
