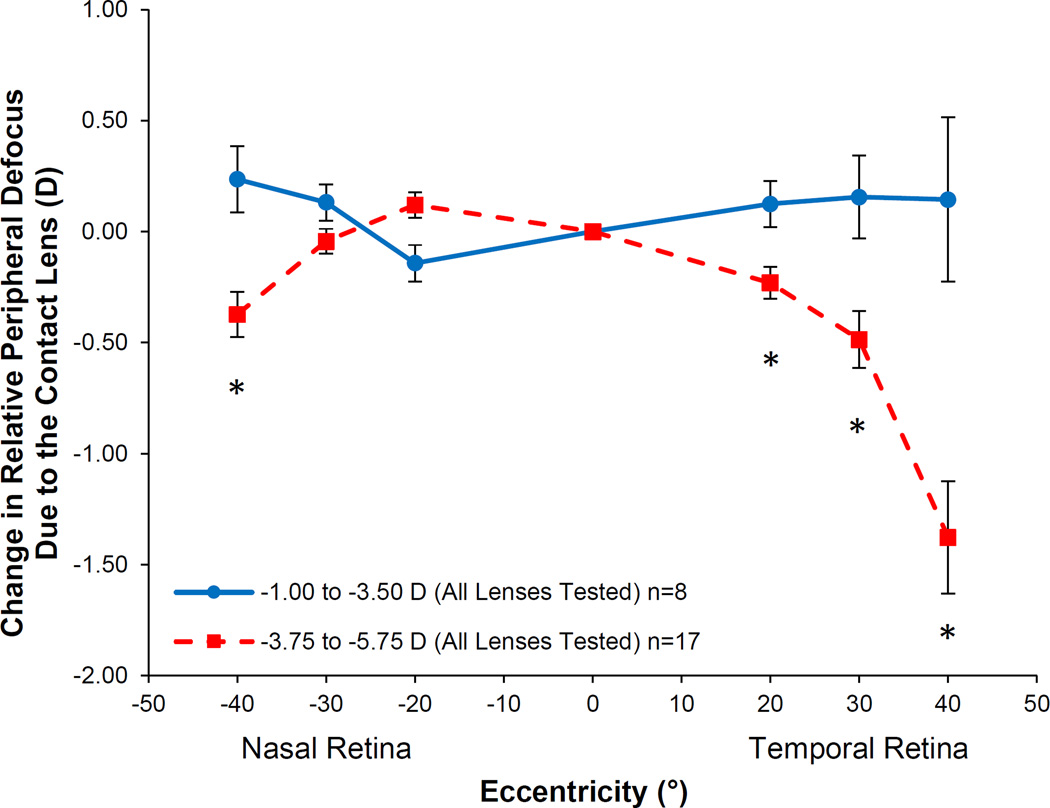
Figure 4.
Change in relative peripheral defocus averaged across the four soft contact lenses split by contact lens power. Positive defocus represents a hyperopic image shift and negative defocus represents a myopic image shift. The asterisks denote eccentricities at which the two groups are significantly different from one another. Error bars represent the SEM.

