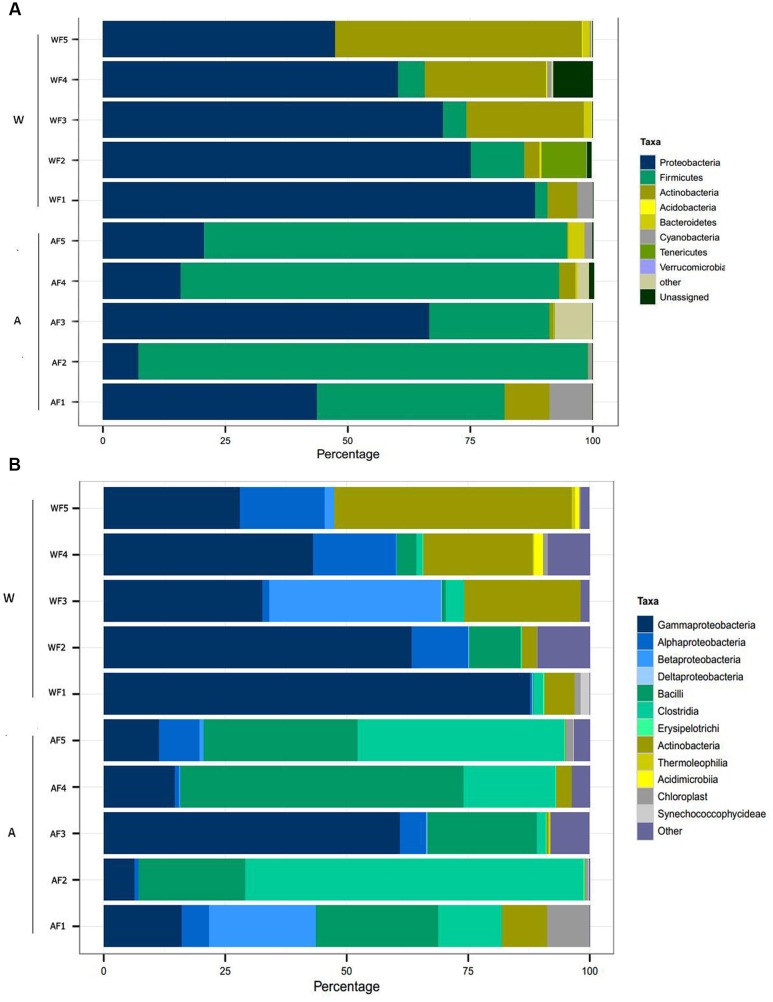
FIGURE 3.
Relative abundance of OTUs at the phylum (A) and class (B) levels in the intestinal microbiota from wild and aquaculture P. adspersus. In the figure, W corresponds to individual wild fish (Wild flounder, WF1 to WF5) and A corresponds to aquaculture fish (Aquaculture flounder, AF1 to AF5). The relative abundance was calculated based on taxonomy assignment using the RDP database.

