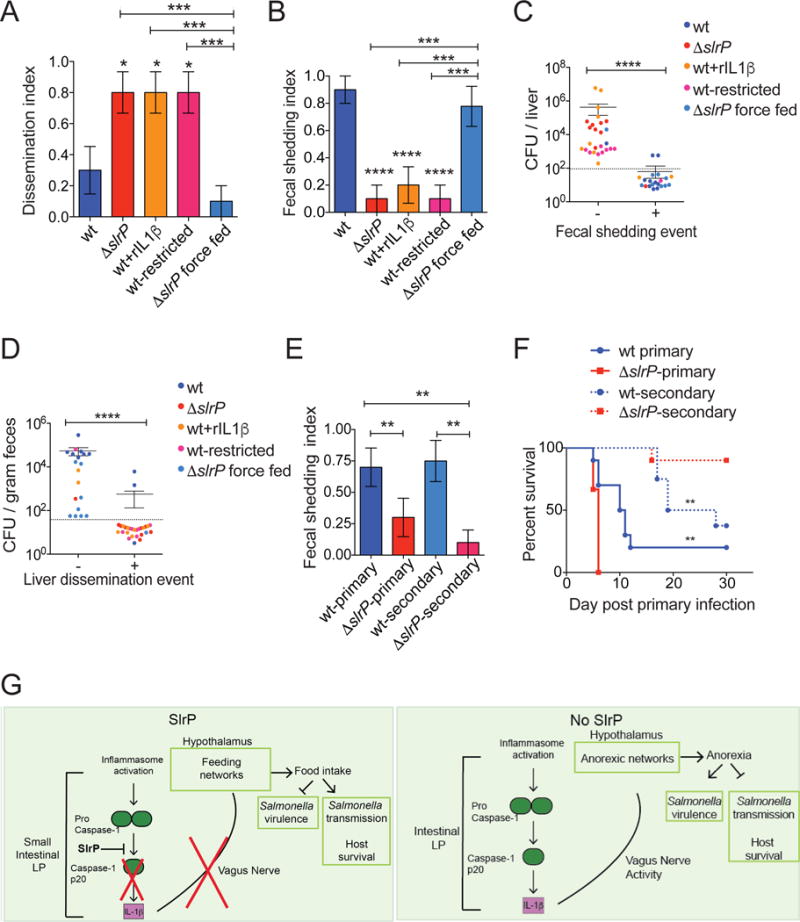
Figure 6. Anorexia creates tradeoffs between virulence and transmission.

(A) Animals were assigned a liver dissemination score of “1” or “0” at 72hr post-infection. n=10/group
(B) Animals from (A) were assigned a score of “1” or “0” to determine fecal shedding index at 72hr post-infection.
(C) CFU in liver of mice from (A) was plotted against fecal shedding index (B) for each individual mouse. “−“ denotes mice with no fecal shedding, and “+” denotes mice with fecal burden.
(D) CFU detected in feces of mice from (A) was plotted against liver dissemination index (C) for each individual mouse. “−“ denotes mice with no liver dissemination, and “+” denotes mice with liver burden.
(E) B6 mice were orally infected with wt or ΔslrP ST (wt-primary or ΔslrP-primary) and co-housed with an uninfected B6 mouse (wt-secondary or ΔslrP-secondary). Fecal samples were collected every 24hrs post-infection from primary and secondary hosts for CFU analysis. Mice were assigned a score of “1” or “0” n=8–15 mice/group. Data combined from 2 experiments.
(F) Survival of mice from (E). 8–10 mice/group. ** represent statistical significance between both primary groups or both secondary groups.
(G) Model of how wt and ΔslrP ST regulate anorexia, virulence and transmission.
****p<0.0001, ***p<0.01, **p<0.05. unpaired student t-test, one way ANOVA with tukey post-test or Log rank analysis. Dotted line indicates limit of detection, and mice with no CFU detected in indicated tissue are indicated by symbols below this line. See Figure S6.
