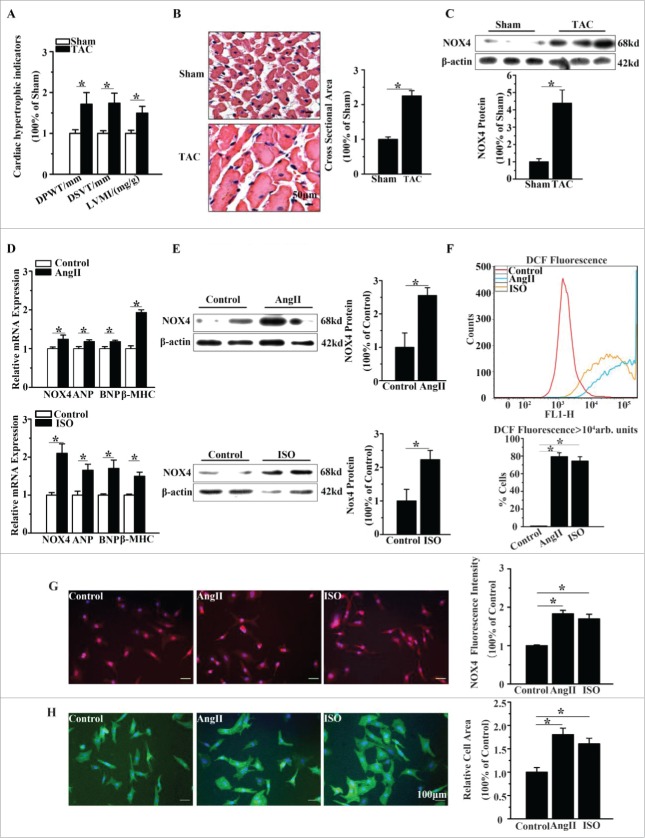
Figure 1.
NOX4 expression was increased in cardiac hypertrophy. (A) Echocardiographic analysis for cardiac hypertrophic indicators(DPWT, DVST, LVMI) in rats 4 weeks after TAC or sham surgery. (B) H&E staining for cross sectional area of caridomyocytes in TAC rats and sham-operated rats. (C) Western blotting analysis for NOX4 expression in heart tissue of TAC or sham-operated rats. (D) mRNA expression of NOX4 and hypertrophic markers(ANP, BNP and β-MHC) in NCMs treated with AngII (10−5M for 24h, Top) or ISO(10−5M for 24h, Bottom). (E) Western blotting analysis for NOX4 in NCMs treated with AngII (10−5M for 24h, Top) or ISO (10−5M for 24h, Bottom). (F) FCM analysis for ROS generation in NCMs treated with AngII (10−5M for 24h) or ISO (10−5M for 24h). (G) Immunofluorescent staining for NOX4 expression (red) in NCMs treated with AngII (10−5M for 24h) or ISO (10−5M for 24h). (H) Surface area determination for NCMs treated with AngII (10−5M for 24h) or ISO (10−5M for 24h). Error bars indicate SEM. n = 6 for A–C and n = 4 for D-H. The fluorescent micrograph is representative of cells from 4 independent visual fields. * indicates P<0.05 versus control group.

