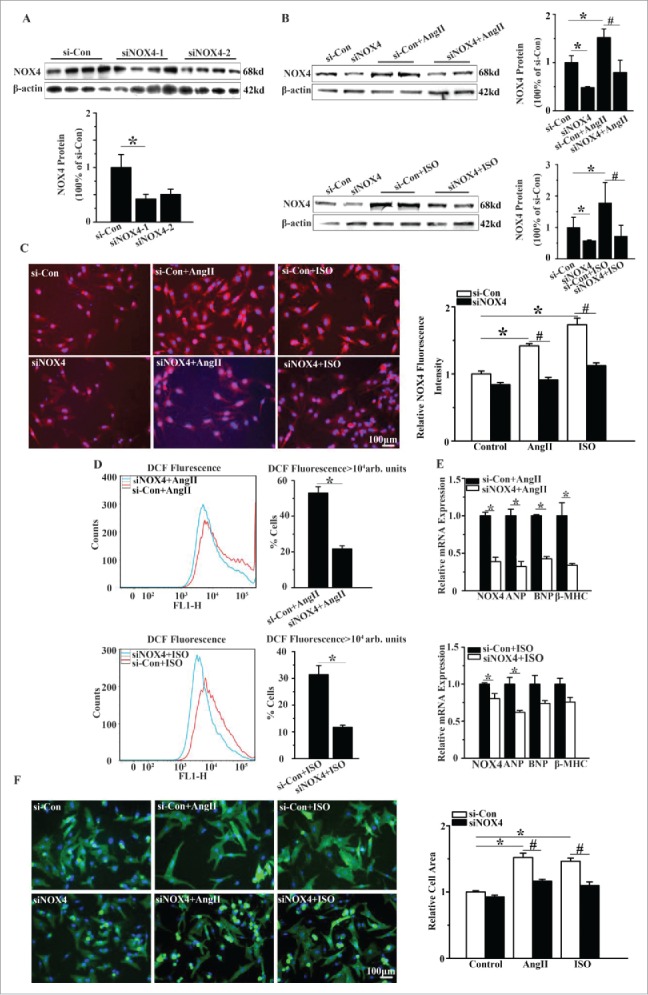
Figure 2.

Silencing of NOX4 by specific siRNA ameliorated cardiomyocyte hypertrophy in vitro. (A) Western blotting analysis for NOX4 in NCMs transfected with siRNA. si-Con, siNOX4-1 and siNOX4-2 group indicate negative control group, NOX4 siRNA groups respectively. * indicates P<0.05 vs. si-Con. (B) Western blotting analysis for NOX4 protein expression in NCMs in the presence or absence of AngII(10−5M for 24h, Top) or ISO (10−5M for 24h, Bottom) after transfected with si-Con or siNOX4. * indicates P<0.05 vs. si-Con; # indicates P<0.05 vs. si-Con+AngII or si-Con+ISO. (C) Immunofluorescence staining for NOX4 expression in NCMs in the presence or absence of AngII(10−5M for 24h) or ISO (10−5M for 24h) after transfected with si-Con or siNOX4. * indicates P<0.05 vs. si-Con; # indicates P<0.05 vs. si-Con+AngII or si-Con+ISO. (D) FCM analysis for ROS generation in NCMs in the presence or absence of AngII (10−5M for 24h, Top) or ISO (10−5M for 24h, Bottom) after transfected with si-Con or siNOX4. * indicates P<0.05 vs. si-Con+AngII or si-Con+ISO. (E) mRNA expression of NOX4 and hypertrophic markers in NCMs in the presence or absence of AngII (10−5M for 24h, Top) or ISO(10−5M for 24h, Bottom) after transfected with siNOX4. * indicates P<0.05 vs. si-Con+AngII or si-Con+ISO. (F) Surface area determination of NCMs treated with AngII (10−5M for 24h) or ISO (10−5M for 24h) after transfected with si-Con or siNOX4. * indicates P<0.05 vs. si-Con; # indicates P<0.05 vs. si-Con+AngII or si-Con+ISO. n = 4 for A-F. The fluorescent micrograph is representative of cells from 4 independent visual fields.
