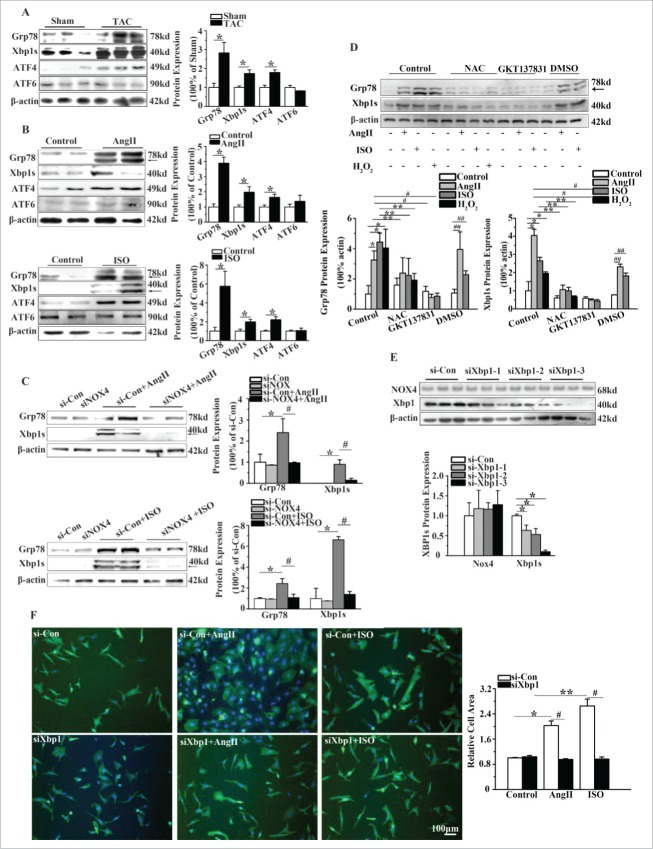
Figure 3.
NOX4 activated Xbp1s in cardiac hypertrophy. (A) Western blotting analysis for Xbp1s in rats 4 weeks after TAC or sham surgery. n = 6. * indicates P<0.05 vs. sham-operated group. (B) Western blotting analysis for Xbp1s in NCMs treated with AngII (10−5M for 24h, Top) or ISO (10−5M for 24h, Bottom). n = 4. * indicates P<0.05 vs. control. (C) Western blotting analysis for Xbp1s in NCMs in the presence or absence of AngII (10−5M for 24h, Top) or ISO (10−5M for 24h, Bottom) after transfected with si-Con or siNOX4. n = 4. * indicates P<0.05 vs. si-Con; # indicates P<0.05 vs. siNOX4+AngII or siNOX4+ISO. (D) Western blotting analysis for Xbp1s signaling in NCMs of indicated groups. NCMs treated with AngII (10−5M for 24h), ISO (10−5M for 24h) or H2O2 (100μM for 2h) showed significantly higher activation of Xbp1 compared to blank group. The activation of Xbp1 was restored by pretreatment with either NAC (10mM for 1h) or GKT137831(5μM for 1h). n = 3. *, ## indicates P<0.05 vs. blank group and DMSO group, respectively; ** indicates P<0.05(AngII, ISO, H2O2 group vs. AngII+NAC, ISO+NAC, H2O2+NAC group, respectively); # indicates P<0.05(AngII and ISO group vs. AngII+GKT137831 and ISO+ GKT137831group, respectively). (E) Western blotting analysis for Xbp1 and NOX4 in NCMs transfected with si-Con or siXbp1(1–3). n = 3. * indicates P<0.05 vs. si-Con group. (F) Surface area determination of NCMs in the presence or absence of AngII (10−5M for 24h) or ISO (10−5M for 24h) after transfected with si-Con or siXBP1. n = 4. The fluorescent micrograph is representative of cells from 4 independent visual fields.

