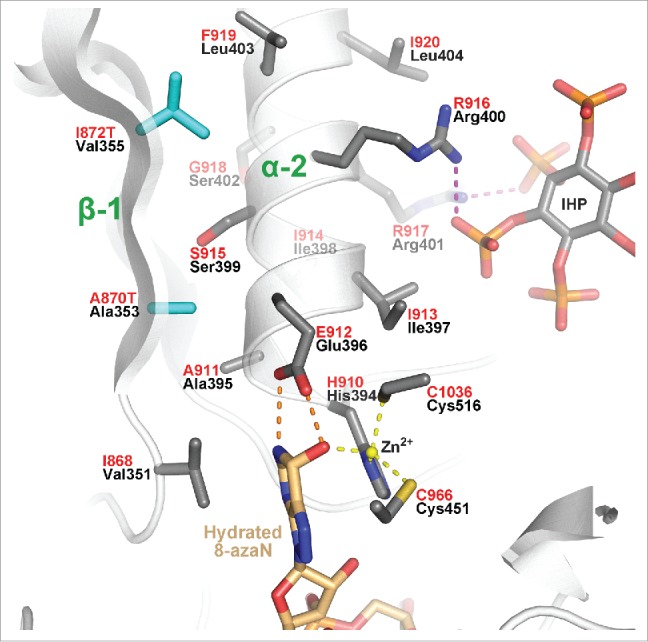
Figure 4.

Close-up view of active site revealing the location of the two buried ADAR1 AGS-causing mutations A870T and I872T (cyan) mapped on the hADAR2 structure. Invariant catalytic residue Glu396/E912 hydrogen-bonds (orange dashed lines) with flipped-out edited base analog; 8-azaN. Zinc coordination is illustrated with yellow dashed lines, and conserved Arginines of helix α2 that interact with IHP phosphates are shown with magenta dashed lines.
