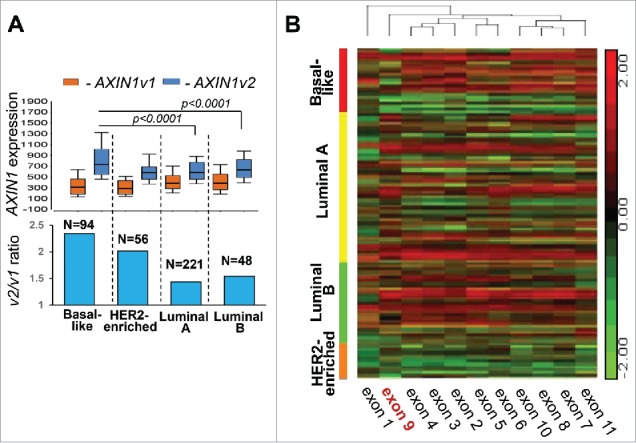
Figure 2.

AXIN1 splice variant expression in breast cancer subtypes. (A) Box-whisker plot describing the differential expression of AXIN1 variants (upper panel) and their ratio (lower panel) in breast cancer subtypes. (B) Semi-supervised hierarchical clustering for expression of AXIN1 exons in breast cancer subtypes. Expression of AXIN1 variants was represented by RSEM normalized values of the individual isoforms and expression of AXIN1 exons was represented by RPKM values in the Level-3 RNA-seqV2 data downloaded from the TCGA data portal. P-values were calculated by ANOVA.
