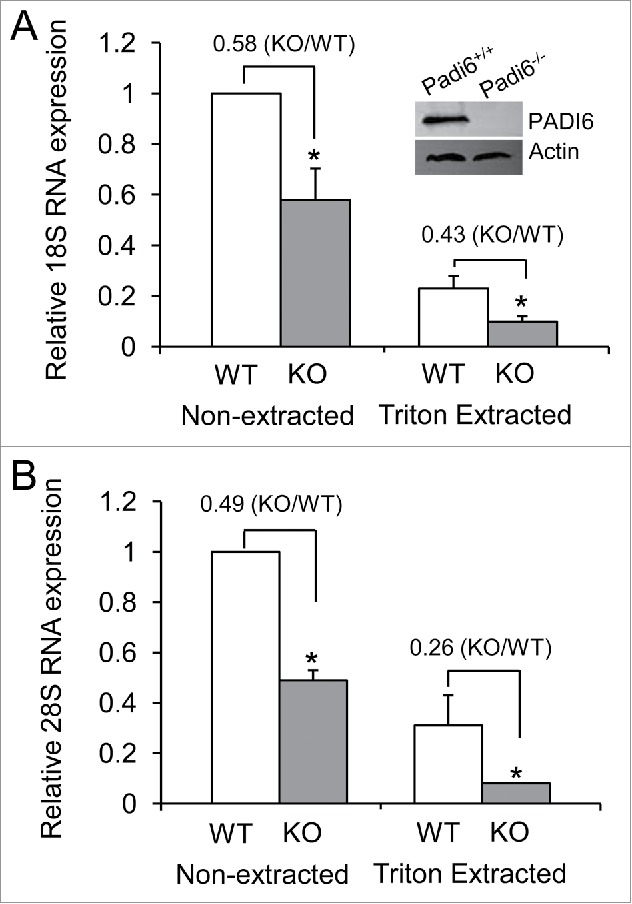
Figure 1.

rRNA quantities are lower and more soluble in Padi6 KO oocytes. (A) Quantitative real time PCR analysis of the 18S rRNA expression in Padi6 WT or KO GV stage oocytes before or after Triton X-100 extraction. The insert shows the depletion of PADI6 in Padi6 knock out oocytes by western blot. Actin was used as a protein loading control. (B) Quantitative real time PCR analysis of the 28S rRNA expression in Padi6 WT or KO GV stage oocytes before or after Triton X-100 extraction. The expression data were normalized to Gapdh. The graph represents the mean ± SD (n = 3). *p < 0.05.
