
Figure 1.
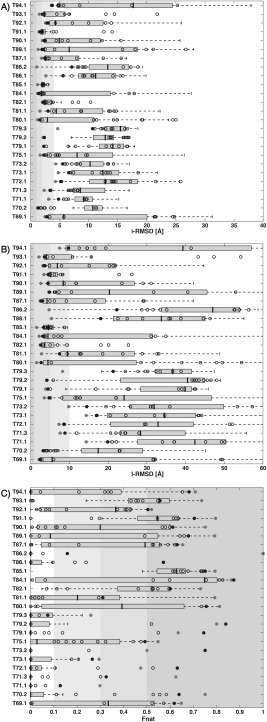
Comparison of the scoring performance of HADDOCK versus the CAPRI community in terms of i‐RMSD, l‐RMSD and Fnat. For each scored interface, the (A) backbone i‐RMSD, (B) l‐RMSD and (C) Fnat values over all the submitted models are reported. Data are shown only for those targets for which at least one acceptable or better solution has been submitted by the community. The number after the target ID refers to the specific interface evaluated in case of multimers with more than two subunits. The i‐RMSD/l‐RMS/Fnat of the HADDOCK models are indicated in black‐empty dots with the best one highlighted with a black‐filled circle and the i‐RMSD/l‐RMSD/Fnat of the best model submitted among the CAPRI scorers except HADDOCK (CAPRI‐community) is indicated by a filled‐gray circle. The box plots report the i‐RMSD/l‐RMSD/Fnat distributions for all models submitted by “others,” each scorer group being allowed to submit 10 models. Background‐gray regions correspond to the thresholds of 4Å/10Å/0.1 for i‐RMSD/l‐RMSD/Fnat, respectively, defining for defining acceptable or better models according to the CAPRI criteria. Increasingly shades of gray have been used for acceptable/medium/acceptable modes thresholds. The median is indication by a thick gray line; the left and right edges of the box indicate the 25th and 75th percentiles, respectively. The whiskers represent all data lying within 1.5 times the interquartile range. Values that falls outside this range are considered outliers and are not shown (plot generated with default values in MATLAB29).