

Abstract
We previously demonstrated pharmacokinetic differences among manufacturing batches of a US Food and Drug Administration (FDA)‐approved dry powder inhalation product (Advair Diskus 100/50) large enough to establish between‐batch bio‐inequivalence. Here, we provide independent confirmation of pharmacokinetic bio‐inequivalence among Advair Diskus 100/50 batches, and quantify residual and between‐batch variance component magnitudes. These variance estimates are used to consider the type I error rate of the FDA's current two‐way crossover design recommendation. When between‐batch pharmacokinetic variability is substantial, the conventional two‐way crossover design cannot accomplish the objectives of FDA's statistical bioequivalence test (i.e., cannot accurately estimate the test/reference ratio and associated confidence interval). The two‐way crossover, which ignores between‐batch pharmacokinetic variability, yields an artificially narrow confidence interval on the product comparison. The unavoidable consequence is type I error rate inflation, to ∼25%, when between‐batch pharmacokinetic variability is nonzero. This risk of a false bioequivalence conclusion is substantially higher than asserted by regulators as acceptable consumer risk (5%).
Study Highlights.
WHAT IS THE CURRENT KNOWLEDGE ON THE TOPIC?
☑ PK bioequivalence studies conventionally compare single manufacturing batches of test and reference.
WHAT QUESTION DID THIS STUDY ADDRESS?
☑ The current work investigates the reproducibility of a previous bio‐inequivalent result between batches of US Advair Diskus 100/50, and assesses the ability of single‐batch bioequivalence studies to accurately estimate the product ratio and associated confidence interval when batch‐to‐batch PK variability is present.
WHAT THIS STUDY ADDS TO OUR KNOWLEDGE
☑ The FDA‐recommended two‐way crossover design to assess PK bioequivalence fails to control the type I error rate when batch‐to‐batch PK variability is present. Batch‐to‐batch variability has been reproducibly demonstrated for Advair Diskus 100/50. Use of a single manufacturing batch leads to an unreliable test/reference estimate and a too‐narrow confidence interval when between‐batch PK variability is ignored.
HOW THIS MIGHT CHANGE CLINICAL PHARMACOLOGY OR TRANSLATIONAL SCIENCE
☑ To align regulation with emerging science, the bioequivalence paradigm requires revision when batch‐to‐batch PK variability is substantial and reproducible. Although between‐batch PK variability is demonstrated here for a specific drug product, this variability source may be present for other products.
Advair Diskus is an orally inhaled dry powder product containing a corticosteroid (fluticasone propionate (FP)) and a long‐acting β2‐agonist (salmeterol xinafoate) to treat the two main components of asthma; inflammation and bronchoconstriction. Since its launch on the US market in 2001, Advair Diskus has become a cornerstone of asthma therapy and is one of the top 10 prescription medications by sales in the US. International guidelines, such as those issued by Global Initiative in Asthma1, 2 and the National Heart, Lung, and Blood Institute,3 advocate the use of inhaled long‐acting β2‐adrenoceptor agonists in combination with inhaled corticosteroids as maintenance therapy in asthma for subjects who remain symptomatic despite low to medium doses of inhaled corticosteroids.
Despite its popularity, there is no generic version of Advair Diskus currently approved for the US market despite patent expiry of the FP and salmeterol active ingredients in 2002 and 2008, respectively. In 2013, the US Food and Drug Administration (FDA) Office of Generic Drugs issued a draft guidance to industry4 that defined the bioequivalence requirements for an FP/salmeterol dry power inhaler. This draft guidance retains the conventional pharmacokinetic (PK) bioequivalence design and analysis methods, namely a two‐way (i.e., two‐treatment, two‐period, two‐sequence randomized) crossover comparison of a single manufacturing batch each of the test (generic candidate) and reference (Advair Diskus) products with a product ratio confidence interval derived from within‐subject residual error as the assumed sole source of variability. Batch‐to‐batch PK variability, however, has been a consistent concern of both regulators and industry for several years in the context of orally inhaled drug product generic development and approval.5, 6, 7, 8 Yet, despite this concern, the FDA has not directly addressed batch‐to‐batch PK variability in its generic approval policies.
Recently, we demonstrated that batch‐to‐batch PK variability is substantial for Advair Diskus 100/50,9 in some cases, demonstrating bio‐inequivalence10 between batches. This variability is not necessarily surprising, given the wide acceptance range on in vitro specifications of the FP/salmeterol dry powder product, specifically the twofold acceptance range for respirable mass per the recent United States Pharmacopeia product‐specific monograph,11 and the low systemic availability of orally inhaled FP, cited as 5.5–16.6%.12, 13, 14 However, large batch‐to‐batch PK variability raises questions regarding the suitability of the conventional single‐batch approach to PK bioequivalence testing.
Here, we present a second and independent demonstration of PK bio‐inequivalence among Advair Diskus 100/50 batches. Given this additional variance component (between‐batch), we assess whether the recommended use of a single manufacturing batch in the PK bioequivalence study design assures the objectives of the FDA's statistical bioequivalence test (i.e., provides an accurate and generalizable estimate of the test/reference ratio and associated confidence interval). We present the results of a clinical study designed to measure the PK from a single manufacturing batch of a generic dry power inhaler candidate (“test”) and three different manufacturing batches of Advair Diskus 100/50 (“reference”) in a four‐way randomized crossover with all pairwise batch comparisons reported. Using average bioequivalence statistical methods, we assess the ability of the conventional 90% confidence interval to quantify confidence not only in the specific batch comparison but also in the product comparison, recognizing that certainty in the product comparison is the true objective of bioequivalence testing. We give particular attention to the data from the reference product, as this is an FDA‐approved product currently on the US market. The goal of this work is to elucidate the increased risk of a type I error (i.e., a false conclusion of bioequivalence) in the two‐way (i.e., single batch) PK bioequivalence study design currently recommended by the FDA for Advair Diskus 100/50. Concern about the type I error rate in bioequivalence studies has been raised previously, although in a different context.15, 16
The PK properties of single‐dose 100 μg FP/50 μg salmeterol from Advair Diskus 100/50 are not present in the literature, outside of the preceding publication.9 Here, we present PK measurements from an additional four treatments with 100 μg FP/50 μg salmeterol. These data, combined with those from the previous publication, provide a robust presentation of the PK of this widely used drug product.
RESULTS
Twenty‐four subjects were allocated to six copies of a four‐treatment, four‐period Williams crossover design. The four treatment sequences used were A‐B‐C‐D, B‐D‐A‐C, C‐A‐D‐B, and D‐C‐B‐A, where “A” was a single manufacturing batch of a generic “test” candidate, and “B,” “C,” and “D” were three different manufacturing batches of Advair Diskus 100/50. Six subjects were randomly assigned to each of the four treatment sequences. All 24 randomized subjects completed all four periods of the study; no data were excluded from the analysis. First screening to last visit occurred between 20 September 2013 and 26 October 2013. Demographics of clinical study participants are given in Table 1. There were no serious adverse events or suspected unexpected serious adverse reactions on the study.
Table 1.
Subject demographics
| EudraCT number | 2013‐003071‐35 |
|---|---|
| Population | Healthy |
| FEV1, % predicted | ≥90% |
| Age, years | 39 ± 10 (22–56) |
| Male/female | 20/4 |
| Weight, kg | 74.3 ± 10.5 (57.8–96.8) |
| Height, cm | 175 ± 6 (166–187) |
| BMI, kg/m2 | 24.2 ± 3.1 (19.7–29.4) |
Data are mean ± SD (minimum–maximum).
BMI, body mass index.
Least square geometric means and the ranges of individual subject values for the PK of FP and salmeterol from individual manufacturing batches are given in Table 2. Figure 1 illustrates the average blood concentration‐vs.‐time profile for FP (first 4 h after inhalation) and salmeterol (first hour after inhalation) from each batch.
Table 2.
Summary of pharmacokinetic parameters for 100 μg FP and 50 μg salmeterol following administration to healthy subjects
| Test | Reference, Advair Diskus 100/50 | |||
|---|---|---|---|---|
| Batch 1 | Batch 1 | Batch 2 | Batch 3 | |
| FP Cmax, pg/mL | 46.5 (25.8–88.5) | 35.0 (17.2–52.1) | 52.9 (20.0–87.5) | 51.7 (21.7–97.5) |
| FP Tmax, min | 10 (4–45) | 10 (3–46) | 9 (3–46) | 8 (3–45) |
| FP AUC(0‐t), h·pg/mL | 140 (61–268) | 141 (53–248) | 208 (90–444) | 185 (83–338) |
| FP AUC(0‐inf), h·pg/mL | 164 (69–250) | 153 (59–211) | 241 (139–467) | 212 (92–354) |
| FP t1/2, h | 11.1 (2.7–22.1) | 12.2 (3.5–27.9) | 12.8 (4.3–24.4) | 12.3 (3.8–23.3) |
| S Cmax, pg/mL | 76.5 (29.7–172) | 71.0 (24.7–126) | 114 (23.9–259) | 100 (28.0–178) |
| S Tmax, min | 4 (3–8) | 4 (3–30) | 4 (3–10) | 4 (3–8) |
| S AUC(0‐t), h·pg/mL | 114 (50–301) | 113 (41–333) | 158 (94–418) | 144 (53–343) |
| S AUC(0‐inf), h·pg/mL | 154 (62–327) | 132 (53–354) | 200 (123–494) | 172 (61–370) |
| S t1/2, h | 13.7 (6.9–23.4) | 12.4 (4.5–34.8) | 14.2 (4.8–23.5) | 16.3 (4.8–52.6) |
Least square geometric mean (range) except Tmax for which the median (range) is reported.
AUC, area under the concentration‐time curve; Cmax, peak plasma concentration; FP, fluticasone propionate; S, salmeterol; Tmax, time of maximum plasma concentration.
Figure 1.
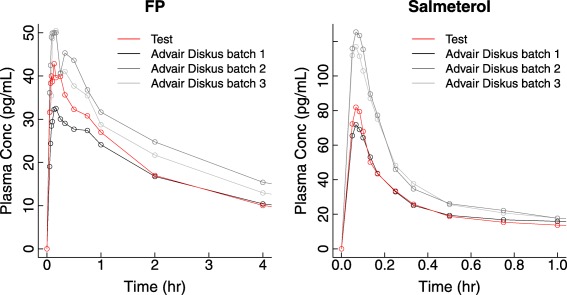
Plasma concentration‐vs.‐time profiles for fluticasone propionate (FP; 100 μg) and salmeterol (50 μg) following single‐dose dry powder oral inhalation to healthy adult subjects as Advair Diskus 100/50 (gray scale) or the test product (red).
At a dose of 100 μg to healthy adult subjects, FP is absorbed rapidly with a peak plasma concentration (Cmax) reached ∼10 min after dosing. FP concentrations decline with an apparent terminal half‐life of ∼12 h. At a dose of 50 μg to healthy adult subjects, salmeterol is absorbed very rapidly, with a Cmax reached ∼4 min after dosing. Distribution of salmeterol is also rapid, such that by 15 min post‐dose the plasma concentration is less than half the peak value. Salmeterol concentrations decline with an apparent terminal half‐life of ∼14 h.
Table 3 and Figure 2 demonstrate that differences among reference batches were observed to be large enough to consistently fail the FDA's PK bioequivalence requirement: all three reference‐vs.‐reference pairwise batch comparisons failed the bioequivalence test required of a generic drug candidate. One comparison (batch 1 vs. batch 2) demonstrated batch‐to‐batch PK bio‐inequivalence, with 90% confidence intervals around the test/reference geometric mean ratio (GMR) of all PK metrics for both drug substances excluding the 80–125% bioequivalence region. For this batch pair, batch‐to‐batch ratios (90% confidence interval) for FP Cmax, FP area under the concentration‐vs‐time curve (AUC), salmeterol Cmax, and salmeterol AUC were observed to reach 151.03% (136.70–166.88%), 156.99% (136.35–180.74%), 159.79% (140.61–181.59%), and 151.39% (133.05–172.26%), respectively, independently confirming the previously published clinical study result of bio‐inequivalence between different batches of Advair Diskus 100/50.9
Table 3.
Bioequivalence assessment between manufacturing batches of Advair Diskus 100/50
| GMR (%) among batches of Advair Diskus 100/50 | ||
|---|---|---|
| Estimate | 90% CI | |
| Batch 1 vs. batch 2 | ||
| FP Cmax | 151.03 | 136.70–166.88 |
| FP AUC(0‐t) | 147.55 | 135.21–161.02 |
| FP AUC(0‐inf) | 156.99 | 136.35–180.74 |
| S Cmax | 159.79 | 140.61–181.59 |
| S AUC(0‐t) | 140.80 | 126.61–156.59 |
| S AUC(0‐inf) | 151.39 | 133.05–172.26 |
| Batch 1 vs. batch 3 | ||
| FP Cmax | 147.64 | 133.42–163.37 |
| FP AUC(0‐t) | 131.28 | 120.14–143.45 |
| FP AUC(0‐inf) | 137.95 | 121.96–156.03 |
| S Cmax | 141.33 | 124.13–160.92 |
| S AUC(0‐t) | 128.28 | 115.16–142.88 |
| S AUC(0‐inf) | 130.28 | 116.41–145.81 |
| Batch 2 vs. batch 3 | ||
| FP Cmax | 102.30 | 92.45–113.20 |
| FP AUC(0‐t) | 112.40 | 102.86–122.82 |
| FP AUC(0‐inf) | 113.80 | 98.03–132.12 |
| S Cmax | 113.06 | 99.30–128.73 |
| S AUC(0‐t) | 109.76 | 98.54–122.27 |
| S AUC(0‐inf) | 116.20 | 102.12–132.23 |
AUC, area under the concentration‐time curve; CI, confidence interval; Cmax, peak plasma concentration; FP, fluticasone propionate; GMR, geometric mean ratio; S, salmeterol.
Figure 2.
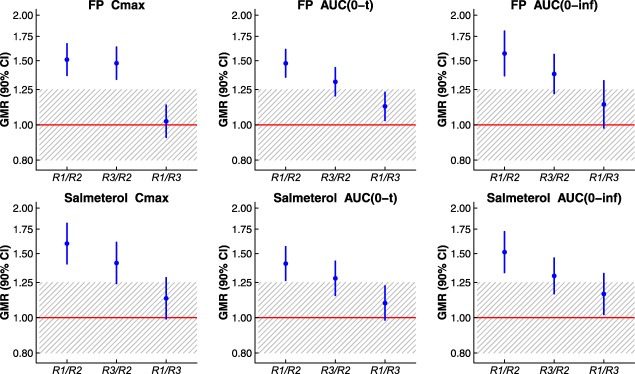
Pharmacokinetic comparisons between individual Advair Diskus 100/50 (reference) batches are shown with geometric mean ratios (GMRs) and 90% confidence intervals (CIs) for fluticasone propionate (FP) and salmeterol maximum observed plasma concentration (Cmax) and area under the plasma concentration‐vs.‐time curve (AUC). Individual reference batches are indicated as “R1,” “R2,” or “R3.” A ratio value of 1.00 is shown via a horizontal red line. The 0.80–1.25 bioequivalence region is crosshatched. The ratio (y) axis is plotted on a log scale.
The test‐vs.‐reference comparison based on individual batch pairs was highly dependent on which batch of reference was selected. Using FP Cmax as an example metric, the test/reference GMR (with 90% confidence interval) for comparison of the test batch to individual reference batches ranged from 88.05% (79.69–97.29%) to 132.99% (120.36–146.94%). Here, these GMR differences are driven almost entirely by between‐batch PK variation in the reference product. Thus, the estimated GMR demonstrated for any single comparison of the test product to an individual reference batch may misrepresent the true relationship between the products in the presence of batch‐to‐batch PK variability. This point is a straightforward conclusion from the variability of reference presented here and in the preceding publication. Implications of between‐batch PK variability on the GMR confidence interval, however, may not be immediately obvious; these implications are considered here, following variance component estimation.
Table 4 presents the estimated magnitudes of within‐subject residual variance ( ) and within‐subject between‐batch variance ( ) for the reference product, for which three different manufacturing batches were administered (thus providing two degrees of freedom on the between‐batch variance component estimate). Of no surprise, given the preceding results, the largest source of variability for most PK metrics was found to come from differences between batches. Again using FP Cmax as an example metric, the estimated between‐batch variance (0.0598) was 1.7‐fold larger than the estimated residual variance (0.0353) and was a highly significant contributor to total variability (P < 0.0001). Results for salmeterol Cmax were similar, with an estimated between‐batch variance (0.0718) 1.2‐fold larger than estimated residual variance (0.0617) and again a highly significant contributor to total variability (P < 0.0001).
Table 4.
Variance component estimation following administration of a single dose of Advair Diskus 100/50 from three different manufacturing batches to healthy subjects
| Metric | DF error |
|
DF batch | F‐value for batch | P value for batch |
|
|||||
|---|---|---|---|---|---|---|---|---|---|---|---|
| Method of Moments | REML | ||||||||||
| estimate |
|
estimate |
|
||||||||
| FP Cmax | 43 | 0.03531 | 2 | 35.92 | < 0.0001 | 0.05984 | 1.69 | 0.06828 | 1.93 | ||
| FP AUC(0‐inf) | 15 | 0.03039 | 2 | 10.85 | 0.0012 | 0.04628 | 1.52 | 0.05808 | 1.91 | ||
| FP AUC(0‐t) | 43 | 0.02578 | 2 | 33.37 | < 0.0001 | 0.04049 | 1.57 | 0.04541 | 1.76 | ||
| S Cmax | 43 | 0.06171 | 2 | 24.97 | < 0.0001 | 0.07179 | 1.16 | 0.08093 | 1.31 | ||
| S AUC(0‐inf) | 26 | 0.04715 | 2 | 9.87 | 0.0006 | 0.03171 | 0.67 | 0.04231 | 0.90 | ||
| S AUC(0‐t) | 43 | 0.03875 | 2 | 18.03 | < 0.0001 | 0.03202 | 0.83 | 0.03573 | 0.92 | ||
All variance estimates are based on an analysis of variance using reference only.
, within‐subject, between‐batch variance estimate; , within‐subject residual error variance estimate; AUC, area under the concentration‐time curve; Cmax, peak plasma concentration; DF, degrees of freedom; FP, fluticasone propionate; REML, restricted maximum likelihood; S, salmeterol.
The within‐subject residual variance identified from the reference data suggests that under the FDA's current definition, Advair Diskus 100/50 would not be considered a highly variable drug product. The current FDA definition of “highly variable” considers only dispositional variability (i.e., variability in the body's handling of the drug, for example, variable absorption or metabolism), without regard for manufacturing or product variability.17 Although here using a methodology (analysis of variance model with batch as a fixed effect, see Methods) that differs from the FDA's batch‐replication approach to assessing residual error,18 because no batches were replicated in the current study, the data yield within‐subject residual standard deviation ( ) estimates of 0.16–0.25 (Table 4), consistently below the FDA's current highly variable drug criterion of within‐subject residual standard deviation ≥0.294. Thus, despite substantial within‐subject PK variability across batches, Advair Diskus 100/50 does not display evidence of high PK variability within a batch, and, therefore, is not likely to be eligible for the FDA's current reference‐scaling methodology that widens the bioequivalence limits according to variability of the reference product.
Variance components within the range estimated from the clinical data (Table 4) were used to construct expected test/reference ratio distributions for a two‐way crossover design with varying amounts of between‐batch PK variability; these are illustrated in Figure 3. The two‐way crossover design was assumed to be two‐treatment (test, reference), two‐sequence (TR, RT), and two‐period, aligned with current FDA bioequivalence study design recommendations. Here, the impact of between‐batch PK variability on the shape of the test/reference ratio distribution is illustrated for distributions centered at a true test/reference ratio of 1.05, and with true residual error variance ( ) of 0.04 (i.e., within‐subject residual standard deviation = 0.20, equivalent to a within‐subject coefficient of variation of 20.2%). When between‐batch variability is zero ( ), conventional sample size calculations for a two‐treatment, two‐period, crossover design indicate that 26 subjects are needed to provide 90% power to conclude bioequivalence for true = 0.04 and a true test/reference ratio of 1.05. If this study design is repeated many, many times, with each study producing estimates of , the test/reference ratio and its confidence interval, the collection of 90% confidence intervals will demonstrate two key features: (1) 90% of the intervals will contain the true test/reference mean ratio; and (2) only 5% of the intervals will lie within the bioequivalence limits (0.80–1.25) if the true test/reference ratio is 0.80 or 1.25 (i.e., when the products are not bioequivalent, bioequivalence will be concluded in only 5% of trials). In general terms, the 90% confidence interval is often interpreted as an interval that provides a good estimate of the true ratio between the test and reference products.
Figure 3.
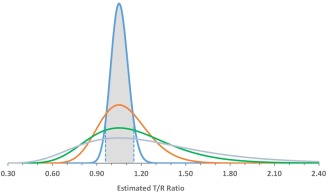
Distributions of the test/reference ratio estimate from a two‐way crossover bioequivalence study design in which a single randomly selected test batch is compared to a single randomly selected reference batch in 26 subjects. On the logarithmic scale, the within‐subject residual error variance is assumed to be 0.04. On the natural scale, the true test/reference ratio is assumed to be 1.05. Specific distributions are shown for between‐batch variance values ) on the log‐scale of zero (blue), 0.01 (red), 0.03 (green), and 0.06 (gray). The expected range of the 90% confidence interval of the test/reference ratio assuming is shown as a shaded area to illustrate the coverage of a 90% confidence interval derived from a two‐way crossover design. For non‐zero , the two‐way crossover design 90% confidence interval provides only a fraction of the coverage provided for .
This interpretation of the standard test/reference confidence interval, however, fails for a two‐way (i.e., two‐period, two‐treatment) crossover design in the presence of between‐batch variability. When the true, underlying mean and within‐subject variance component values are test/reference , , and , the expected 90% confidence interval for the design can be shown to be 0.955–1.155, indicated by the filled portion of the “ ” distribution in Figure 3. Due to widening of the test/reference ratio distribution by the addition of between‐batch variability, this (alleged) “90%” confidence interval covers the true test/reference mean ratio with a probability of only 46%, 29%, or 21% when between‐batch variance ( ) is 0.01, 0.03, or 0.06 (indicated by the red, green, and gray distributions in Figure 3, respectively). Thus, the two‐way crossover design confidence interval (that cannot estimate between‐batch variability and therefore ignores it in confidence interval construction (i.e., underestimates true total within‐subject variability)) can no longer be interpreted as providing a good interval estimate of the test/reference ratio. The two‐way crossover design confidence interval is, simply, incorrectly narrow.
It is this inadequate confidence interval coverage that is directly responsible for inflation of the type I error rate. The type I error rate from the two‐way crossover design with true underlying values of , and T/R = 1.25 is 5%, the conventionally accepted upper limit on consumer risk. However, the same study design using test and reference products with inherent between‐batch variance of 0.01, 0.03, or 0.06 (i.e., / variance ratios of 0.25, 0.75, and 1.50) leads to an inflation of the type I error rate to 25%, 27%, or 23%, respectively (Figure 4). When the null hypothesis ( , nonequivalence) is true and the confidence interval is correctly calculated (as in the case of a two‐way crossover design when between‐batch variance is zero), there is only a 5% chance of the confidence interval being fully contained within the bioequivalence limits. But, with non‐zero between‐batch variance, the observed test/reference ratio varies widely with an increased opportunity of being close to 1.0, thus increasing the chance of (incorrectly) rejecting (i.e., confidence interval entirely contained within 0.80–1.25), if the confidence interval remains artificially narrow (i.e., does not also reflect the widening of the underlying distribution). Hence, the type I error rate is increased.
Figure 4.
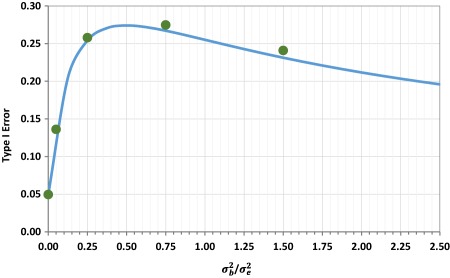
The type I error rate from a two‐way crossover bioequivalence study design in which a single randomly selected test batch is compared to a single randomly selected reference batch in 26 subjects. On the logarithmic scale, the within‐subject residual error variance ( ) is assumed to be 0.04. Log‐scale between‐batch variance ( ) is assumed to vary from zero to 0.10 (corresponding to variance ratios ranging from zero to 2.5), with equal between‐batch variance on test and reference products. To assess the type I error rate, the true test/reference ratio is assumed to be 1.25 on the natural scale. Simulation results (green circles) are compared to the approximate analytical solution (blue line).
The steep dependence of the type I error rate on between‐batch variance, as between‐batch variance increases from zero, emphasizes the importance of acknowledging between‐batch variability in the PK bioequivalence assessment for those drug products for which even small levels of between‐batch variability are anticipated or demonstrated. In the two‐way crossover study described above (26 subjects, , T/R = 1.25), a between‐batch variance only 5% of residual error variance (i.e., ) inflates the type I error rate to 14% (Figure 4). As expected, when study designs ignore variability, the results are prone to misinterpretation.
The type I error rate does not increase monotonically with between‐batch variability. Initially, increases in variability between batches increases the probability of demonstrating bioequivalence in a two‐way crossover design, due to chance batch selection, even when bioequivalence is an incorrect conclusion. Further increases of between‐batch variability reduce the probability of demonstrating bioequivalence regardless of whether bioequivalence is the correct answer or not, as the probability diminishes of selecting, by chance, batches that agree. However, the region of inflated type I error rate persists for what seems to be the full extent of clinically realistic variance values; the probability of an incorrect bioequivalence conclusion does not fall below 5% for the two‐way crossover study example considered here until between‐batch variance is overwhelming (type I error rate returns to ≤5% for / variance ratios exceeding ∼50).
DISCUSSION
For many (perhaps most) drug products, process controls limit product variability sufficiently well to allow a single manufacturing batch to represent the product for bioequivalence testing. In a conventional PK bioequivalence study, single manufacturing batches each of the test and reference products are compared. Both regulators and industry consider this design as providing a bioequivalence result that is generalizable and representative of patients' experience in commercial use of the products over time, all predicated on the assumption that batch‐to‐batch PK variability is negligible.
However, certain products and dosage forms are more susceptible to batch‐to‐batch PK variability. For example, here, and previously, we have demonstrated that PK variability among manufacturing batches of the FP/salmeterol dry powder combination product Advair Diskus 100/50 is unmistakably present and too substantial to ignore. In both the previous study9 and again here, PK differences between Advair Diskus 100/50 batches are large enough to demonstrate PK bio‐inequivalence of the product to itself, with conventional 90% confidence intervals entirely excluding the 80–125% bioequivalence region. This additional source of variability poses important challenges for bioequivalence testing. The European Medicines Agency has formally acknowledged PK batch‐to‐batch variability, and suggested potential approaches.19 To date, however, PK batch‐to‐batch variability is neither addressed nor accounted for in any FDA bioequivalence guidance.
The marked failure of the reference product to meet the PK bioequivalence criteria when tested against itself is not a consequence of the relatively small study size, in fact, the use of only 24 subjects makes a demonstration of bio‐inequivalence more difficult. Nor are the between‐batch PK differences attributable to use of reference product near the end of shelf‐life; all reference batches had more than 5 months remaining until expiry at the time of dosing. The reference product does not demonstrate high dispositional variability, per the FDA's definition of a highly variable drug product, but does demonstrate batch‐to‐batch PK differences larger than are consistent with the statistical test of bioequivalence applied to test‐vs.‐reference comparisons.
The FDA's statistical test for bioequivalence, using average bioequivalence methodology, is a requirement on the 90% confidence interval around the geometric mean test/reference ratio (GMR). Here, we have shown that the confidence interval constructed from a conventional bioequivalence study design (i.e., one batch of test vs. one batch of reference), although correct for the single specific batch of test and reference selected for that particular study, cannot be generalized, with adequate error rate control, to the product comparison when there is unaccounted batch‐to‐batch PK variability. When batch‐to‐batch PK variability is present but ignored, the standard error of the GMR is underestimated and the calculated confidence interval is artificially narrow, thus inflating the type I error rate and increasing the risk of erroneous licensing decisions.
Using estimates of residual and between‐batch variance that are representative of the clinical observations, we have quantified the type I error rate inherent in the FDA‐recommended two‐way crossover design. The resulting broadening of the product ratio distribution with increasing between‐batch variability increases the type I error rate (“consumer's risk”) to ∼25%, as increased variability in the product ratio increases the probability of observing a batch ratio within the bioequivalence region even when the product ratio is nonequivalent. This type I error rate inflation cannot be eliminated by an increase in the number of study subjects because the source of the inflation is variability between batches, not between subjects. Of note, the FDA‐mandated in vitro bioequivalence testing for inhalation products already requires inclusion of multiple manufacturing batches per product (minimum of three), presumably to address exactly the issue of between‐batch variability.
The implications of unaccounted batch‐to‐batch PK variability on bioequivalence conclusions are illustrated here for the two‐way crossover design because this study design is ubiquitous in bioequivalence testing, and is explicitly referenced in the Advair Diskus 100/50 product‐specific FDA draft guidance.4 The extent of type I error rate inflation could be moderated with more sophisticated study designs, although discussion of such alternate designs is beyond the scope of the current paper. Additionally, we have assumed, for symmetry and simplicity, that batch‐to‐batch PK variability affects the test and reference products equally. Absence of batch‐to‐batch PK variability in the test product mitigates, but does not eliminate, type I error rate inflation. The specific impact of batch‐to‐batch PK variability on the bioequivalence assessment will depend on the details of study design, and test and reference product performance. The principle of incorporating clinical data from multiple batches, however, remains an essential and necessary component of bioequivalence testing following emergence of credible data demonstrating batch diversity.
Just as the FDA's reference‐scaling method18 eliminates unnecessary human testing for products with high dispositional variability, so too could an extension of this statistical methodology reduce the regulatory burden in instances of batch‐to‐batch PK variability. Advair Diskus 100/50 does not display high dispositional variability for either of its active ingredients (i.e., within‐subject residual standard deviation <0.294). Instead, Advair Diskus 100/50 PK variability is inherent to the product and is not the consequence of variation introduced by the body's action on the drug. Because there is no public information to suggest significant changes to the reference product since its approval, it is reasonable to expect that this product‐based variability was present during the innovator's safety and efficacy testing. Accordingly, as with high dispositional variability, the variability indicates a wide therapeutic index for this combination product. At present, however, there is no statistical method approved by regulators for handling between‐batch PK variability of any magnitude. In a subsequent presentation, we propose an extension of the FDA's existing reference‐scaling methodology to accommodate between‐batch variability.
Between‐batch variability in bioequivalence testing is analogous to heterogeneity in meta‐analyses, in which randomized trials of similar design, subject population, and primary endpoint can give disparate results. In these instances, the treatment effect observed in any single trial does not provide a reliable estimate of the truth–only the average effect across several trials accommodates the heterogeneity to provide a reliable estimate with associated confidence interval. Importantly, a critical feature of meta‐analysis in the presence of trial heterogeneity (i.e., random‐effect meta‐analysis)20 is that the heterogeneity across trials (here, across batches) is directly incorporated into the confidence interval to reflect the extent to which different outcomes are possible even within the constraints of the controlled clinical trial environment.
Aside from between‐batch diversity, aspects of FP and salmeterol PK when administered as a single inhalation of 100 μg (FP) or 50 μg (salmeterol) merit comment. Time to peak FP plasma concentration (Tmax) was observed to be ∼10 min, consistent with a report from single‐inhalation repeated administration of Advair Diskus 100/50,21 but earlier than observed for higher doses. FP Tmax values in healthy subjects following single‐dose dry powder (Diskus) inhalation have been reported as ranging from 25–66 min at 1,000 μg (as four 250‐μg inhalations),12, 22 and 45–75 min at 400 μg (as four 100‐μg inhalations).23 It may be that FP absorption rate, and, therefore, Tmax, is sensitive to the total FP dose. The apparent terminal elimination half‐life of FP reported here of 12 h is similar to previous reports.24, 25 The PK of 50 μg salmeterol in healthy subjects following dry powder oral inhalation was previously reported.9, 26, 27 The salmeterol Tmax of 4 min and terminal half‐life of ∼14 h are consistent with these previous reports.
METHODS
The PK of FP and salmeterol were observed in 24 enrolled (24 evaluable) healthy adult subjects in a clinical study performed under clinical trials authorization from the UK Medicines and Healthcare Products Regulatory Agency and approval by the National Research Ethics Service Committee. Written informed consent was obtained from all subjects, and the study was conducted in accordance with the principles of the Declaration of Helsinki.
Study design
A single dose of 100‐μg FP with 50‐μg salmeterol was administered by oral inhalation as either Advair Diskus 100/50 (“reference”) or the strength‐matched development product (“test”). The study used a four‐period, four‐sequence design and was conducted as a single‐center, randomized, open‐label, crossover, single‐dose study in healthy adult men and women at the Quintiles Drug Research Unit at Guy's Hospital, London, UK. The primary objective was determination of each of the six pairwise batch comparisons (i.e., T/R1 T/R2, T/R3, R1/R2, R1/R3, and R2/R3), using conventional average bioequivalence methodology, in which “T” indicates the single batch of the test product and “R1,” “R2,” and “R3” indicate the three batches of the reference product.
Advair Diskus 100/50 (GlaxoSmithKline, Research Triangle Park, NC) was purchased directly from the US market and used within labeled expiry. All reference batches were supplied to the European clinical site in a single insulated shipment with temperature monitoring, and stored in a single temperature‐controlled pharmacy to ensure that all batches were handled identically. The strength‐matched test product was manufactured for Oriel Therapeutics as powder‐blend combination of micronized FP (100 μg), micronized salmeterol as the xinafoate salt (50 μg), and lactose monohydrate, an inert excipient, contained in a multidose dry power inhaler device similar in size and operation to the commercially available reference product.
All study treatments were administered under supervision and participants remained in the clinic for the duration of dosing and PK collection. The dosing procedure followed the instructions provided to patients in the Advair Diskus Medication Guide,10 namely exhalation, quick and deep inhalation with 10‐s breath‐hold, and mouth rinse. Subjects were fasted overnight for at least 10 h prior to dosing until 4 h postdose. Water was allowed ad lib except 1 h prior through 1 h postdose. Crossover treatments were separated by a washout of at least 7 days.
Clinical study participants
Participants (≥18 years; body weight ≥50 kg; body mass index = 18.8–29.8 kg/m2 [inclusive]) had no history of asthma, a fractional exhaled nitric oxide value ≤47 ppb and a forced expiratory volume in 1 s (FEV1) ≥90% of predicted at screening.
Pharmacokinetic samples
Serial blood samples (6 mL) were drawn for determination of FP and salmeterol concentrations prior to each dose and postdose following inhalation at 3, 4, 5, 6, 8, 10, 15, 20, 30, and 45 min and 1, 2, 4, 8, 12, 16, 24, 32, 40, 48, and 56 h.
Blood samples were centrifuged within 30 min of collection at ∼2,000 g for 15 min at 4°C. The bioanalysis of FP and salmeterol was conducted by Covance (Salt Lake City, UT) using a validated liquid chromatography tandem mass spectrometry method with a quantitative range from 1.00–200 pg/mL for each analyte.
Pharmacokinetic analysis
Estimated PK parameters were maximum observed plasma concentration (Cmax) and time to Cmax (Tmax), areas under the concentration‐vs.‐time curve to the last time of quantifiable concentration (AUC(0‐t)) calculated using the linear trapezoidal method and extrapolated to infinity (AUC(0‐inf)), and elimination rate constant (λz) and corresponding half‐life (t1/2).
Statistical analysis
PK parameter least square geometric means were determined for individual batches using an analysis of variance (ANOVA) model with fixed effects for batch, period, and sequence, and a random subject‐within‐sequence term, using natural logarithms of the data. Treatments were compared using average bioequivalence methods. Treatment ratio point estimates and confidence intervals were exponentiated back to the original scale for display.
Comparison of the relative magnitudes of within‐subject residual error variance and within‐subject between‐batch variance is presented for the reference product, for which the PK from three different manufacturing batches was measured. Variance component estimation was based on a type III analysis using SAS PROC MIXED that provided a full ANOVA table indicating sources of variation (including residual error variance), associated degrees of freedom, sums of squares, mean squares, and also expected mean squares, the error term and error degrees of freedom for each of the expected mean squares. These outputs allowed method of moments estimation of the variance components for the random effect terms specified in the PROC MIXED model code. A supplementary analysis using the PROC MIXED option method=REML to provide restricted maximum likelihood (REML) estimation for the variance components was performed.
Test/reference ratio distributions from a two‐way crossover involving a single batch each of test and reference were determined using a SE of the log test/reference ratio estimate, , of where m is the number of subjects per sequence (2m total clinical study participants), is within‐subject estimated residual error variance, and and are estimated batch‐to‐batch variance for test and reference, respectively. If batch‐to‐batch variance for test and reference are of equal magnitude, SE becomes . With batch‐to‐batch variability, the correct 90% confidence interval for the log test/reference ratio is given by , whereas the simple two‐way crossover that is ignorant of batch‐to‐batch variability gives a 90% confidence interval of ; in both cases represents the 100(1‐α)th percentile of the centralized t‐distribution with degrees of freedom. Hence, when is non‐zero, the correct confidence interval is wider than that from a two‐way crossover that ignores batch‐to‐batch variability. It is this underestimation of the confidence interval in the two‐way crossover design that gives rise to an increased type I error rate.
The type I error rate is easily simulated for a two‐way (i.e., 2 × 2) crossover when there is both within‐subject residual and between‐batch variability. Denoting treatment sequences 1 and 2 as T→R and R→T, respectively, the basic 2 × 2 crossover model is given by:
where: = effect of subject in sequence group , , , = effect of period , , = effect of treatment given in period , sequence group , = random error associated subject , period , sequence group , , and independently , .
Batch‐to‐batch variability is incorporated into each simulated trial by adding a reference product batch effect, , to all subjects in period , sequence and period , sequence where , , and, similarly, a test product batch effect, , to all subjects in period , sequence 1 and period , sequence where , , , are mutually independent. Illustrative results from 10,000 trial simulations are tabulated below Supplemental Table 1 for = 0.04 and and .
Alternatively, the type I error rate may be arrived at by an approximate analytical approach. Consider the usual null and alternative hypotheses:
where and denote true test and reference log mean PK parameter values, with . is rejected if the observed difference in log means is small, i.e., if . If we consider the standard bioequivalence alternative hypothesis of , we have:
Thus, for any two‐way crossover,
Hence,
We may approximate the type I error as:
where represents the centralized t‐distribution with .
Hence,
Approximate Type I error =
At the trial design stage, we substitute and for their assumed values and to give:
Approximate type I error
Of note, this formula reduces to the standard sample size approach used by commercially available software (e.g., SAS, nQuery Advisor) for = 0. The approximate analytical results are shown alongside trial simulation results in the tabulation provided in the Supplemental Table M1. As expected, a close match is evident.
AUTHOR CONTRIBUTIONS
E.B.G., K.J.C., J.M., L.Z.B., and B.J. wrote the manuscript. E.B.G. designed the research. E.B.G. performed the research. K.J.C. analyzed the data.
CONFLICT OF INTEREST
E.B.G. is an employee of Oriel Therapeutics, an indirect wholly owned subsidiary of Novartis Pharma AG. K.J.C. and L.Z.B. are paid consultants to Oriel Therapeutics. B.J. and J.M. are employees of Novartis Pharma AG. J.M. was supported by the Swiss State Secretariat for Education, Research, and Innovation, contract number 999754557. Opinions expressed and arguments used herein do not necessarily reflect the official views of the Swiss Government. J.M.'s work is part of the IDEAS European training network (http://www.ideas‐itn.eu/) from the European Union's Horizon 2020 research and innovation program under the Marie Sklodowska‐Curie grant agreement No. 633567. The study was paid for by Oriel Therapeutics.
Supporting information
Supporting Information
References
- 1. British Thoracic Society, Scottish Intercollegiate Guidelines Network . British guideline on the management of asthma. Thorax 63 (suppl. 4), iv1–iv121 (2008). [DOI] [PubMed] [Google Scholar]
- 2. Global Initiative for Asthma (GINA) . Global strategy for asthma management and prevention. <www.ginasthma.org> (2009).
- 3. National Institute of Health (NIH) . Guidelines for the Diagnosis and Management of Asthma–Expert Panel Report 3. US Department of Health and Human Services, Bethesda, MD: NIH Publication No. 07‐4051. <www.nhlbi.nih.gov/files/docs/guidelines/asthgdln.pdf> (2007).
- 4. Draft Guidance on Fluticasone Propionate ; Salmeterol Xinafoate. U.S. Department of Health and Human Services, Food and Drug Administration, Center for Drug Evaluation and Research (CDER), September 2013.
- 5. Evans, C. et al Equivalence considerations for orally inhaled products for local action—ISAM/IPAC‐RS European workshop report. J. Aerosol Med. Pulm. Drug Deliv. 25, 117–139 (2012). [DOI] [PubMed] [Google Scholar]
- 6. Generics for oral inhaled drugs: knowledge gaps for streamlining bioequivalence approval? <http://www.fda.gov/downloads/drugs/newsevents/ucm359793.pdf> (June 2013).
- 7. Interpreting Pharmacokinetics for Inhalation Bioequivalence. <http://ipacrs.org/assets/uploads/outputs/06_Day_2_OIC_Lionberger.pdf> (2014).
- 8. Hochhaus, G. , Horhota, S. , Hendeles, L. , Suarez, S. & Rebello, J. Pharmacokinetics of orally inhaled drug products. AAPS J. 17, 769–775 (2015). [DOI] [PMC free article] [PubMed] [Google Scholar]
- 9. Burmeister Getz, E. , Carroll, K.J. , Jones, B. & Benet, L.Z. Batch‐to‐batch pharmacokinetic variability confounds current bioequivalence regulations: a dry powder inhaler randomized clinical trial. Clin. Pharmacol. Ther. 100, 223–231 (2016). [DOI] [PMC free article] [PubMed] [Google Scholar]
- 10. Background Information for Advisory Committee for Pharmaceutical Science: Concept and Criteria of BioINequivalence. <http://www.fda.gov/ohrms/dockets/ac/04/briefing/2004‐4078B1_06_BioINequivalence.pdf> (2004).
- 11. USP 39 NF 34 Fluticasone Propionate and Salmeterol Inhalation Powder. Official May 1, 2016.
- 12. Mackie, A.E. , McDowall, J.E. , Falcoz, C. , Ventresca, P. , Bye, A. & Daley‐Yates, P.T. Pharmacokinetics of fluticasone propionate inhaled via the Diskhaler and Diskus powder devices in healthy volunteers. Clin. Pharmacokinet. 39 (suppl. 1), 23–30 (2000). [DOI] [PubMed] [Google Scholar]
- 13. Brindley, C. , Falcoz, C. , Mackie, A.E. & Bye, A. Absorption kinetics after inhalation of fluticasone propionate via the Diskhaler, Diskus and metered‐dose inhaler in healthy volunteers. Clin. Pharmacokinet. 39 (suppl. 1), 1–8 (2000). [DOI] [PubMed] [Google Scholar]
- 14. Advair Diskus Prescribing Information. Research Triangle Park, NC: GlaxoSmithKline; <https://www.gsksource.com/pharma/content/dam/GlaxoSmithKline/US/en/Prescribing_Information/Advair_Diskus/pdf/ADVAIR‐DISKUS‐PI‐MG.PDF> (2014). [Google Scholar]
- 15. Endrenyi, L. & Tothfalusi, L. Regulatory and study conditions for the determination of bioequivalence of highly variable drugs. J. Pharm. Pharm. Sci. 12, 138–149 (2009). [DOI] [PubMed] [Google Scholar]
- 16. Muñoz, J. , Alcaide, D. & Ocaña, J. Consumer's risk in the EMA and FDA regulatory approaches for bioequivalence in highly variable drugs. Stat. Med. 35, 1933–1943 (2016). [DOI] [PubMed] [Google Scholar]
- 17. Davit, B.M. et al Implementation of a reference‐scaled average bioequivalence approach for highly variable generic drug products by the US Food and Drug Administration. AAPS J. 14, 915–924 (2012). [DOI] [PMC free article] [PubMed] [Google Scholar]
- 18. Draft Guidance on Progesterone. U.S. Department of Health and Human Services, Food and Drug Administration, Center for Drug Evaluation and Research (CDER), February 2011.
- 19. Questions & Answers: positions on specific questions addressed to the Pharmacokinetics Working Party (PKWP). European Medicines Agency, Committee for Human Medicinal Products. <http://www.ema.europa.eu/docs/en_GB/document_library/Scientific_guideline/2009/09/WC500002963.pdf> (2015).
- 20. DerSimonian, R. & Laird, N. Meta‐analysis in clinical trials. Control. Clin. Trials 7, 177–188 (1986). [DOI] [PubMed] [Google Scholar]
- 21. Mehta, R. , Riddell, K. , Gupta, A. , Louey, M.D. & Chan, R.H. Comparison of the pharmacokinetics of salmeterol and fluticasone propionate 50/100 μg delivered in combination as a dry powder via a capsule‐based inhaler and a multi‐dose inhaler. Clin. Drug Investig. 35, 319–326 (2015). [DOI] [PubMed] [Google Scholar]
- 22. Gillespie, M. , Song, S. & Steinfeld, J. Pharmacokinetics of fluticasone propionate multidose, inhalation‐driven, novel, dry powder inhaler versus a prevailing dry powder inhaler and a metered‐dose inhaler. Allergy Asthma Proc. 36, 365–371 (2015). [DOI] [PubMed] [Google Scholar]
- 23. Vutikullird, A.B. , Gillespie, M. , Song, S. & Steinfeld, J. Pharmacokinetics, safety, and tolerability of a new fluticasone propionate multidose dry powder inhaler compared with fluticasone propionate Diskus® in healthy adults. J. Aerosol Med. Pulm. Drug Deliv. 29, 207–214 (2016). [DOI] [PubMed] [Google Scholar]
- 24. Thorsson, L. , Dahlström, K. , Edsbäcker, S. , Källén, A. , Paulson, J. & Wirén, J.E. Pharmacokinetics and systemic effects of inhaled fluticasone propionate in healthy subjects. Br. J. Clin. Pharmacol. 43, 155–161 (1997). [DOI] [PMC free article] [PubMed] [Google Scholar]
- 25. Thorsson, L. , Edsbäcker, S. , Källén, A. & Löfdahl, C.G. Pharmacokinetics and systemic activity of fluticasone via Diskus and pMDI, and of budesonide via Turbuhaler. Br. J. Clin. Pharmacol. 52, 529–538 (2001). [DOI] [PMC free article] [PubMed] [Google Scholar]
- 26. Burmeister Getz, E. , Fuller, R. & Jones, S. Salmeterol pharmacokinetics following a 50‐mcg dose by dry powder oral inhalation to healthy volunteers. Eur. Respir. J. 40 (suppl. 56), Abstract P1965 (2012). [Google Scholar]
- 27. Kirby, S. et al Salmeterol and fluticasone propionate given as a combination. Lack of systemic pharmacodynamic and pharmacokinetic interactions. Eur. J. Clin. Pharmacol. 56, 781–791 (2001). [DOI] [PubMed] [Google Scholar]
Associated Data
This section collects any data citations, data availability statements, or supplementary materials included in this article.
Supplementary Materials
Supporting Information