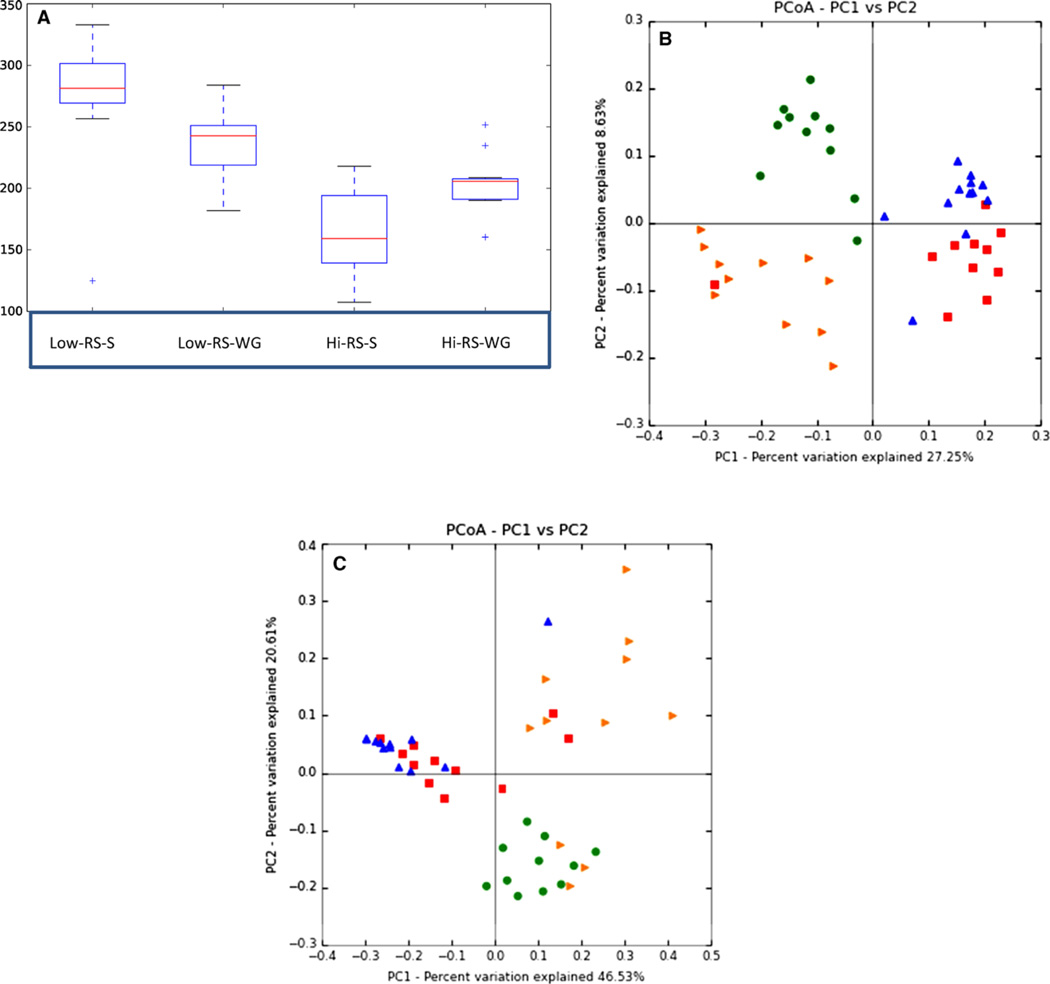
Figure 1.
α-Diversity (chao1) and principal coordinate analysis of the UniFrac β-diversity metrics of the microbiota. Treatments listed in all figure components are: Low-RS-S (diet with amylopectin corn starch), Low-RS-WG (diet with dent whole-grain corn flour), Hi-RS-S (diet with high amylose starch), and Hi-RS-WG (diet with high amylose whole-grain corn flour). (A) α-Diversity in box plots form. Statistical differences were Low-RS-S and Low-RS-WG versus Hi-RS-S p < 0.0006; Low-RS-S versus Hi-RS-WG p < 0.005, and Low-RS-WG versus Hi-RS-WG p < 0.04). (B) Unweighted β-diversity p < 0.0001. (C) Weighted β-diversity p < 0.0001. The legend for β-diversity is: Low-RS-S (squares), Low-RS-WG (upright triangles), Hi-RS-S (right-tilted triangles), Hi-RS-WG (circles).

