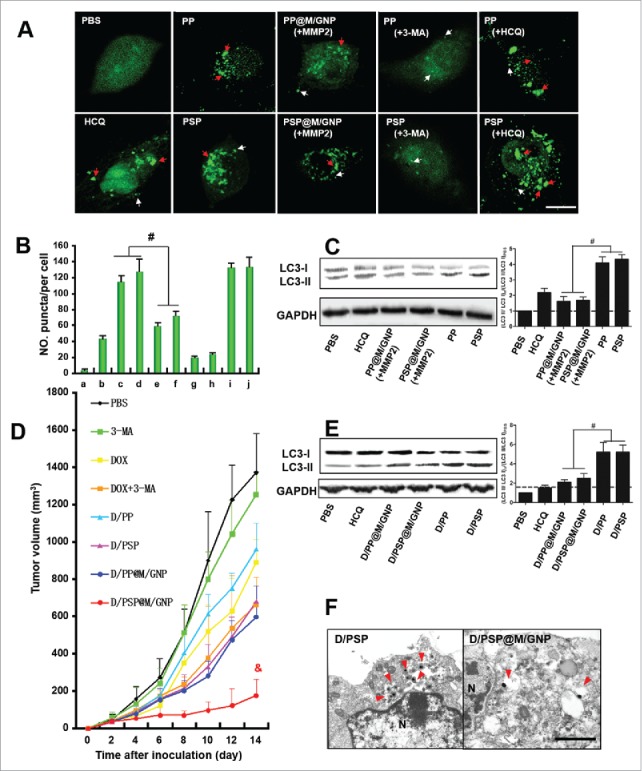
Figure 8.

The autophagic flux assessment and antitumor activity. (A) Observation and (B) Quantitative analysis of eGFP-labeled autophagosomes. White arrows indicate the small puncta; red arrows indicate the dense puncta. Scale bar: 5 μm. (C) LC3 expression of cells. (D) Tumor growth curves. (E) LC3 expression of tumors. (F) Electron micrographs of tumors. Red arrows indicate autophagic vesicles. Scale bar: 500 nm. # and and indicates p < 0.005 and p < 0.001 versus the other groups, respectively. HCQ, hydroxychloroquine. [In panel A, change “a” to “i,” “b“ to “ii,” etc. or simply delete these letters. In B, insert a space after “No.” In C and E change to LC3-I“ and “LC3-II.”
