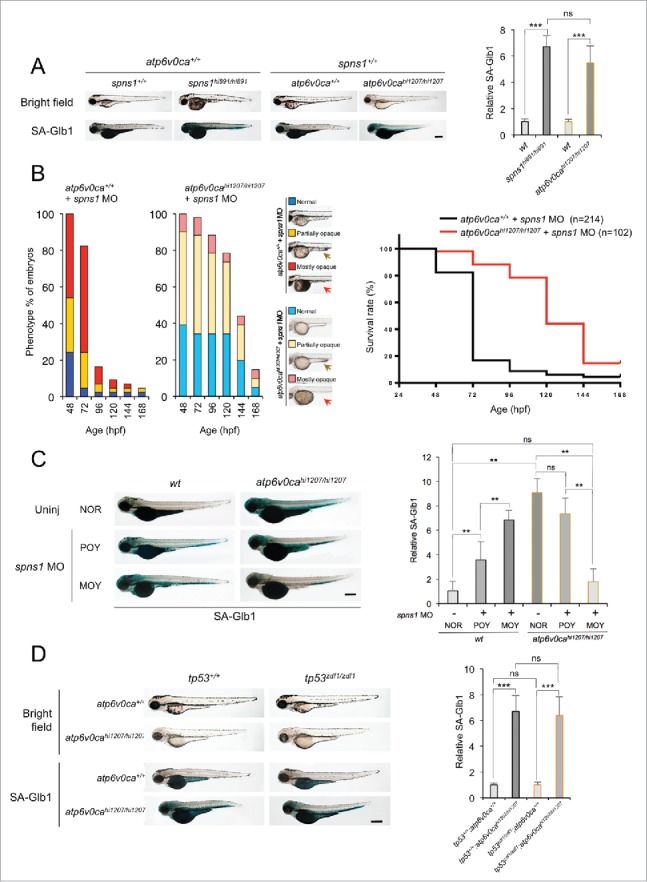
Figure 2.

Counteractive balancing of developmental senescence induced by the defect of Spns1 and Atp6v0ca. (A) Induction of developmental senescence with the defect of either Spns1 or Atp6v0ca at 84 hpf. Scale bar: 500 µm. Quantification of the SA-Glb1 intensities is shown in the right graph (the number [n] of animals for each genotype = 6). Error bars represent the mean ± SD, ***P < 0.0005; ns, not significant. (B) Phenotype appearance of yolk opaqueness and survival of offspring cohorts from intercrosses of atp6v0cahi1207/+ fish. Comparisons of survival rates between wt (atp6v0ca+/+) and atp6v0cahi1207/hi1207 fish injected with spns1 MO are shown in the right survival curves (log rank test: χ2 = 99.36 on one degree of freedom; P < 0.0001). The arrows mark the yolk extension, which has largely regressed in embryos displaying the MOY phenotype. (C) Inverse correlation of strength of yolk opacity (NOR, normal; POY, partially opaque yolk; MOY, mostly opaque yolk) and SA-Glb1 activity in atp6v0ca-mutant animals injected with spns1 MO at 84 hpf. Scale bar: 500 µm. Quantification of the SA-Glb1 intensities is shown in the right graph (the number of animals for each genotype and phenotype = 6). Error bars represent the mean ± SD, **P < 0.001; ns, not significant. (D) Effect of a tp53 mutation on embryonic SA-Glb1 activity in the atp6v0ca mutant. The heritable impact of Tp53 and Atp6v0ca on SA-Glb1 induction was tested in each single-gene mutant (atp6v0cahi1207/hi1207 or tp53zdf1/zdf1) and double mutant atp6v0cahi1207/hi1207;tp53zdf1/zdf1 (atp6v0ca−/−;tp53 zdf1/zdf1) compared with WT animals at 84 hpf. Scale bar: 500 µm. Quantification of the SA-Glb1 intensities in WT, tp53zdf1/zdf1, atp6v0cahi1207/hi1207 and atp6v0cahi1207/hi1207;tp53zdf1/zdf1 animals, shown in the right graph (n = 10); the number (n) of animals is for each genotype. Error bars represent the mean ± SD, ***P < 0.0005; ns, not significant.
