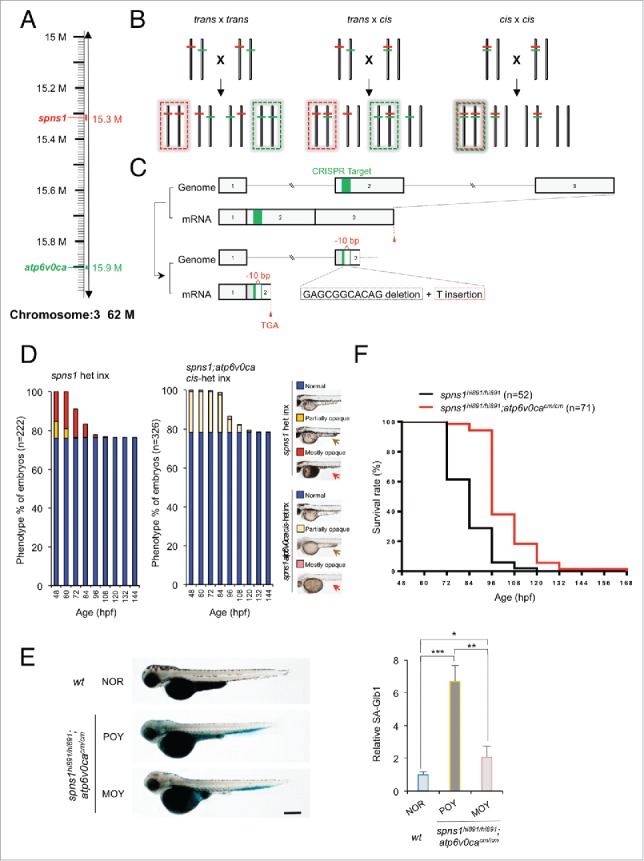
Figure 4.

CRISPR/Cas9-mediated knockout of the atp6v0ca gene in spns1-mutant zebrafish. (A) Distance of the spns1 and atp6v0ca loci at the same linkage group of chromosome 3. M, mega-base pairs. (B) Schemes for trans- and cis-heterozygosity of the spns1 and atp6v0ca loci generated by Crisper/Cas9-mediated genome editing at chromosome 3. Chromosome pairs in the dashed “red” squares contain homozygous spns1 mutations with opaque-yolk phenotype and lethality. Chromosome pairs in the dashed “green” squares contain homozygous atp6v0ca mutations with hypopigmented phenotype and lethality. Double homozygous mutations generated by cis x cis concurrently show both opaque-yolk and hypopigmented phenotypes. (C) A schematic presentation of CRISPR/Cas9-mediated genome editing for the atp6v0ca gene. (D) Phenotype appearance of yolk opaqueness and survival of offspring cohorts from intercrosses (inx) of spns1hi891/+fish and spns1hi891/+;atp6v0cacm/+ fish. (E) SA-Glb1 images of spns1;atp6v0ca-double mutants with partially opaque yolk (POY) and mostly opaque yolk (MOY) phenotypes compared with a normal wild-type (WT) phenotype animal. Quantification of the SA-Glb1 intensities is shown in the right graph (n = 8); the number (n) of animals is for each genotype and phenotype. Error bars represent the mean ± SD, *P < 0.005, **P < 0.001, ***P < 0.0005. (F) Comparisons of survival rates between Spns1-deficient and double Spns1- and Atp6v0ca-deficient animals (log rank test: χ2 = 54.16 on one degree of freedom; P < 0.0001).
