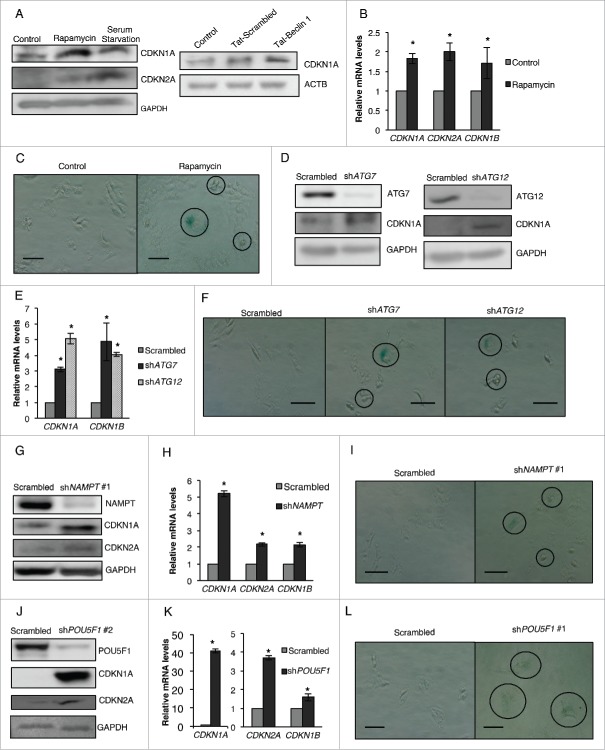
Figure 10.
Decrease in pluripotency is coupled with an increase in senescence. (A) NT2/D1 cells treated with rapamycin or serum starvation were subjected to WB analysis for CDKN1A and CDKN2A and NT2/D1 cells treated with Tat-scrambled or Tat-BECN1 peptide were subjected to WB analysis for CDKN1A (B) Rapamycin-treated cells were subjected to qRT-PCR analysis for CDKN1A, CDKN2A and CDKN1B mRNA levels. (C) GLB1 staining was performed to confirm the presence of senescent cells following rapamycin treatment. (D) ATG7 and ATG12 KD NT2/D1 cells were subjected to WB analysis for CDKN1A and (E) qRT-PCR analysis for CDKN1A and CDKN1B. (F) GLB1 staining was performed to confirm the presence of senescent cells following ATG7 and ATG12 KD. (G) NAMPT KD NT2/D1 cells were subjected to WB analysis for CDKN1A and CDKN2A and (H) qRT-PCR analysis for CDKN1A, CDKN2A and CDKN1B. (I) GLB1 staining was performed to confirm the presence of senescent cells following NAMPT KD. (J) POU5F1 KD NT2/D1 cells were subjected to WB analysis for CDKN1A and CDKN2A and (K) qRT-PCR analysis for CDKN1A, CDKN2A and CDKN1B. (L) GLB1 staining was performed to confirm the presence of senescent cells following POU5F1 KD. Statistical analysis was performed with the 2-tailed, Student t test with 95% confidence interval; *P values ≤ 0.05 obtained by comparing the respective data with the untreated or scrambled control. Scale bar: 100 µm.

