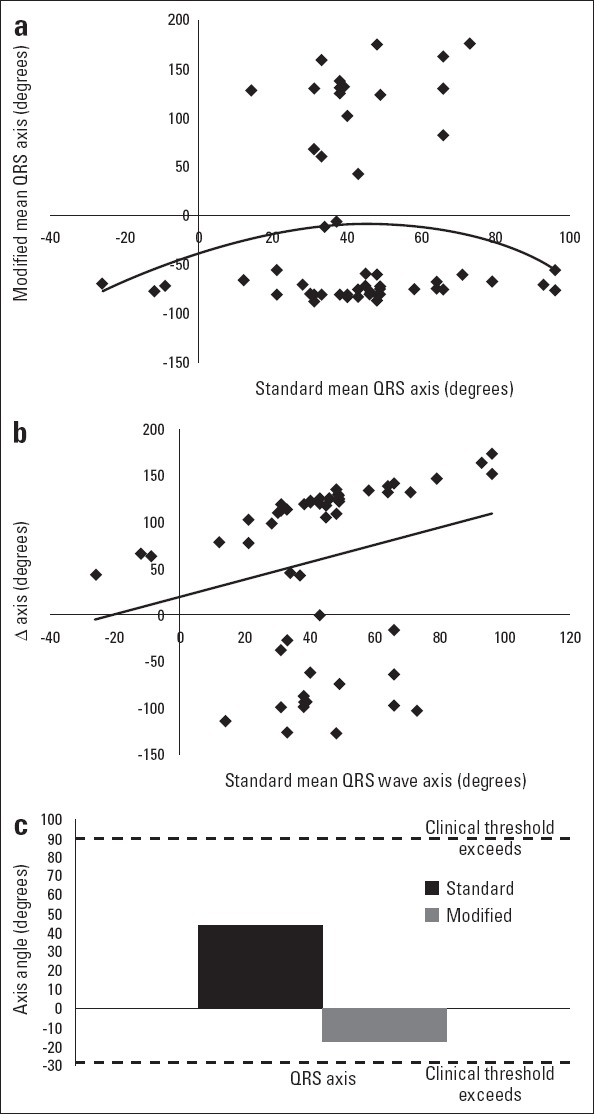
Figure 3.

(a) Distribution of mean QRS wave axis in standard and modi-fied position and curvilinear regression calculated from the axis values (b) Distribution of mean QRS wave axis in standard position (x-axis) ver-sus the change in the measurement when the electrodes are moved to the torso and linear regression calculated from the axis values (c) Mean electrical axes of the QRS complex in standard and modified position showing the thresholds for clinical abnormality
