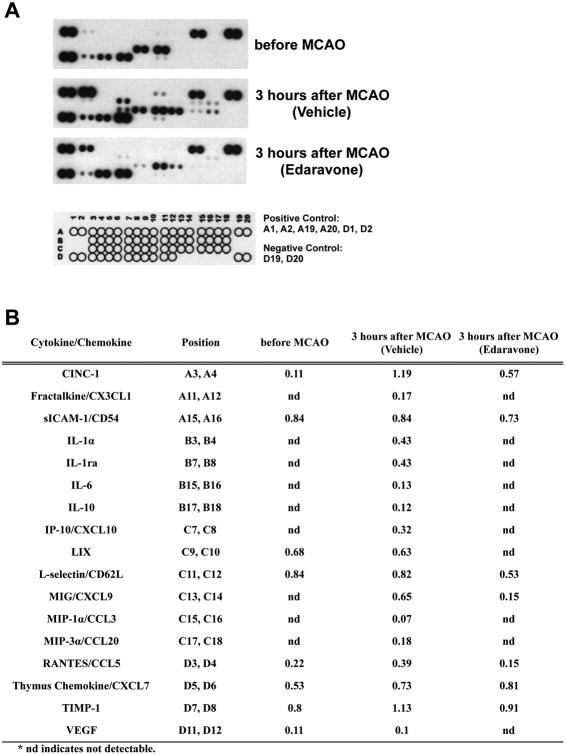
Figure 3. A cytokine/chemokine array analysis in rat plasma.
(A) Images of chemiluminiscent intensity from the cytokine/chemokine array. Schematic image indicates the layout of cytokines and chemokines being measured. Three rat plasma samples were tested with the cytokine/chemokine array - before MCAO, 3 hours after MCAO (vehicle-treated), and 3 hours after MCAO (edaravone-treated). These samples were confirmed to contain average levels of IL-1β (tested by IL-1β ELISA) and MMP-9 (tested by gelatin zymography) before the protein array experiments. (B) Quantitative readouts from the array measurements. Optical density of each signal was measured by Image-J, and each value was calculated based on signals of the positive controls in the same membrane.

