Figure 1.
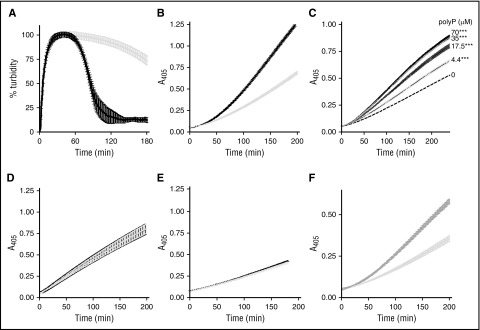
αFXIIa plasminogen activator activity is enhanced by polyP70. (A) Clots were formed with 3.8 μM fibrinogen, 0.24 μM Glu-plasminogen, and 200 nM αFXIIa in the absence (gray) and presence (black) of 70 μM polyP70. Clotting was initiated with 0.25 U/mL of thrombin and 10 mM CaCl2, and subsequent lysis was monitored at 405 nm. Mean data ± SEM is expressed as percentage turbidity (n = 5; P < .0001). (B) Plasminogen activation was analyzed by incubating 200 nM αFXIIa and 200 nM plasminogen in the absence (light gray) or presence (black) of 70 μM polyP70. Plasmin activity was detected using the chromogenic substrate S2251 at 405 nm. Data represent mean ± SEM (n = 3; P < .0001). (C) αFXIIa-mediated plasminogen activation was analyzed in the presence of various concentrations of polyP70 by incubating 200 nM αFXIIa and 200 nM plasminogen in the absence (dashed line) or presence of 70, 35, 17.5, or 4.4 μM polyP70, as indicated. Plasmin activity was detected using the chromogenic substrate S2251 at 405 nm. Data represent mean ± SEM (n = 3; P < .0001). (D) Similarly, direct effects of polyP on preformed plasmin (6.25 nM) were analyzed in the absence (gray line) and presence (black line) of 70 μM polyP70 with S2251. Data represent mean ± SEM (n = 3; P = .93). (E) Activation of plasminogen (200 nM) by βFXIIa (200 nM) was monitored in the absence (gray) and presence (black) of 70 μM polyP70 and was detected using S2251. Data represent mean ± SEM (n = 4; P = .71). (F) Plasminogen activation was analyzed by incubating 200 nM αFXIIa and 200 nM plasminogen in the absence (light gray) or presence (dark gray) of 70 μM platelet-derived polyP. Plasmin activity was detected using the chromogenic substrate S2251 at 405 nm. Data represent mean ± SEM (n = 3; P < .0001). A, absorbance; SEM, standard error of the mean.

