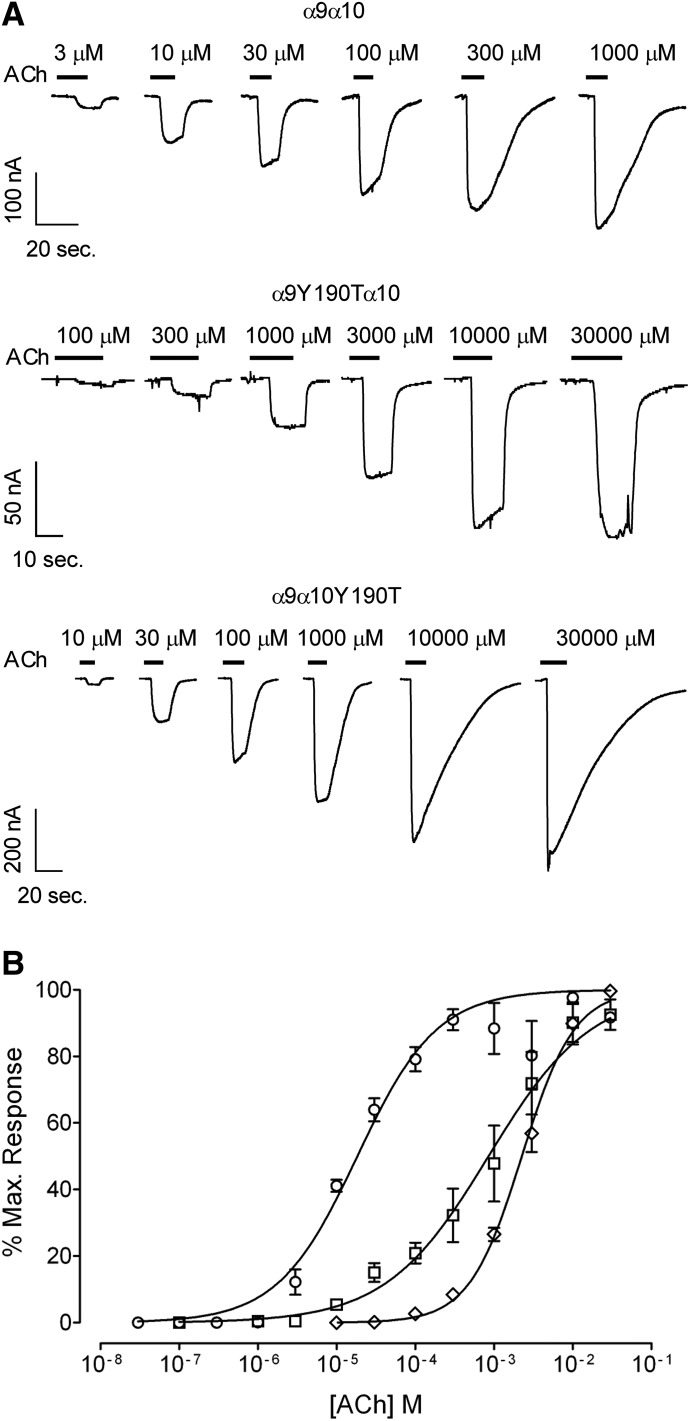
Fig. 2.
Effect of the Y190T mutation on the response to ACh of rat α9α10 receptors. (A) Representative traces of responses evoked by increasing ACh concentrations in oocytes expressing wild-type (upper panel), α9Y190Tα10 (middle panel), and α9α10Y190T (lower panel) receptors. (B) Concentration-response curves to ACh performed in oocytes expressing wild-type (○), α9Y190Tα10 (□), and α9α10Y190T (◊) receptors. Peak current values were normalized and refer to the maximal peak response to ACh in each case. The mean and S.E.M. of 5–8 experiments per group are shown.

