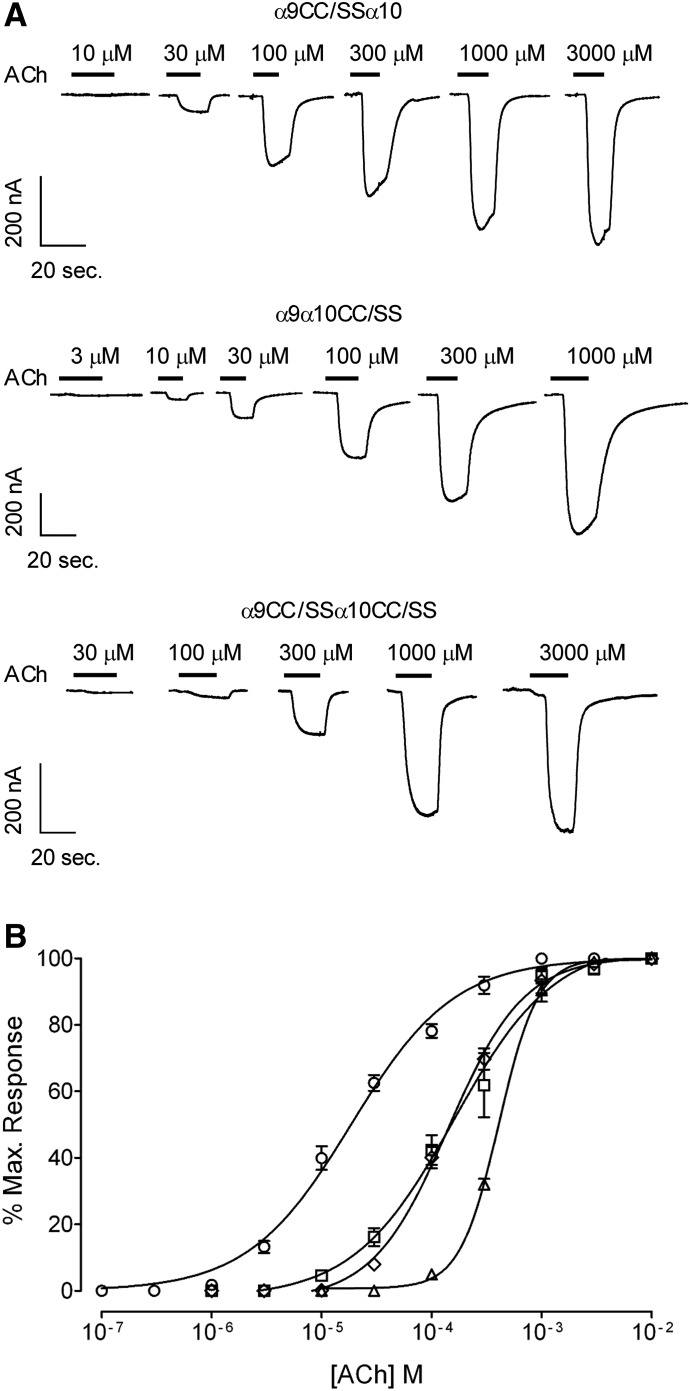
Fig. 3.
Effect of the CC192/193SS (CC/SS) mutations on the response to ACh of rat α9α10 receptors. (A) Representative traces of responses evoked by increasing ACh concentrations in oocytes expressing α9CC/SSα10 (upper panel), α9α10CC/SS (middle panel), and α9CC/SSα10CC/SS (lower panel) receptors. (B) Concentration-response curves to ACh performed in oocytes expressing wild-type (○), α9CC/SSα10 (□), α9α10CC/SS (◊), and α9CC/SSα10CC/SS (△) receptors. Peak current values were normalized and refer to the maximal peak response to ACh in each case. The mean and S.E.M. of 6–17 experiments per group are shown.

