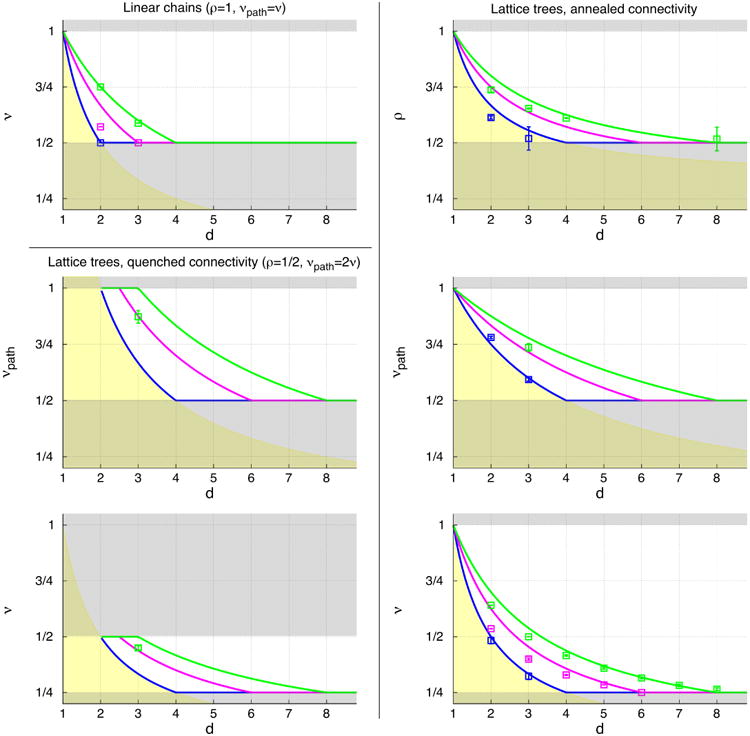
Fig. 3.

Exponents ρ, νpath and ν for: linear chains (upper panel on the left, ρ = 1 and νpath = ν), trees with quenched ideal connectivity (middle and bottom panels on the left, ρ = 1/2), trees with annealed connectivity (panels on the right). Solid lines correspond to predictions of Flory theory: green is for single chains in good solvent (Eq. (16) for linear chains, Eqs. (17a)-(17b) for quenched trees and Eqs. (18a)-(18c) for annealed trees); magenta is for single chains in θ-solvent (Eq. (20) for linear chains, Eqs. (21a)-(21b) for quenched trees and Eqs. (22a)-(22c) for annealed trees); blue is for chains in melt (Eqs. (23a)-(23b) for, respectively, linear chains and quenched trees with ideal connectivity and Eqs. (24a)-(24c) for annealed trees). Grey- and yellow-shading regions indicate violations of the following physical constraints on the values of the exponents: (grey) 1/2 ≤ ρ ≤ 1, 1/2 ≤ νpath ≤ 1 and 1/4 ≤ ν ≤ 1 for lattice trees and 1/2 ≤ ν ≤ 1 for linear chains; (yellow) the fractal dimension df = 1/ν of any object placed in space must be ≤d. For annealed trees, given Eqs. (4), (10) and (11), constraints for one exponent map to the corresponding constraints for the others. This is not the case for quenched trees, where constraints for νpath restrict corresponding values of ν to a narrower region. Symbols are for computer simulations and analytical results boldfaced in Tables 1–4.
