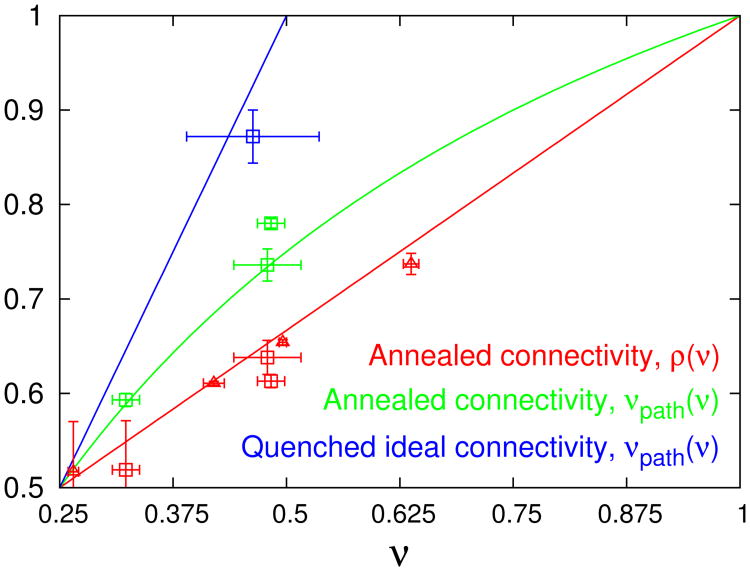
Fig. 4.
Exponents ρ and νpath are plotted as a function of ν following the expressions Eqs. (10), (11) for annealed trees (red and green lines) and with ρ = 1/2 (blue line) for trees with quenched ideal connectivity. Symbols correspond to numerical results for: (triangles) annealed dilute trees in good solvent in d = 2,3,4,855; (squares) annealed and quenched dilute trees in good solvent in d = 362 and annealed tree melts in d = 2,363.

