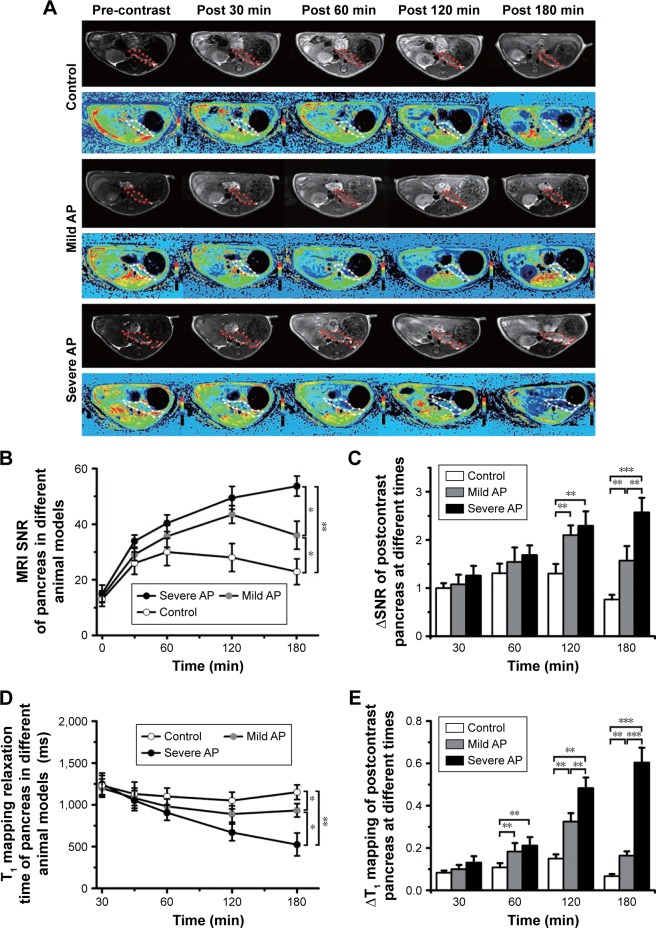
Figure 5.
The application of M-Gd-NL in discriminating mild and severe AP.
Notes: After mild or severe AP models were established, the rats bearing AP were injected with M-Gd-NL via the tail veins (0.1 mmol/kg Gd-DTPA, 5 rats per group). (A) The rats were imaged five times by MRI (before treatment: pre-contrast; 5 min after injection: post 5 min; 60 min after injection: post 60 min; 120 min after injection: post 120 min; 180 min after injection: post 180 min). T1WI MRI scans (in the same plane) of the pancreases of rats in each group were performed using the 3.0T Siemens Healthcare MRI system by wrist coil. The T1WI images of rat model in each group were obtained. (B) For quantitative analysis, the T1WI SNR of the ROIs (which were manually drawn on the pancreas images; as shown with red and white dotted lines), and (C) ΔSNR of the ROIs were presented as the change of SNR from baseline as equation: ΔSNR = (post-contrast SNR – pre-contrast SNR)/pre-contrast SNR. In order to determine whether T1 relaxation times of ROIs can predict the status of pancreas, (D) the corresponding map images were obtained by quantitative T1 mapping based on a respiratory-gated variable-flip-angle technique. (D) Maps of T1 were created with custom Matlab scripts (TheMathworks, Natick, MA, USA). (E) The data were presented as the change in T1 from baseline, ΔT1, caused by the presence of the contrast agent M-Gd-NL within the ROIs at time as outlined in equations: ΔT1 = (pre-contrast T1 – post-contrast T1)/pre-contrast T1. All comparisons were performed between the two groups by one-way analysis of variance with Newman–Keuls posttest. Data are expressed as mean ± standard deviation (n=5). *P<0.05; **P<0.01; ***P<0.001.
Abbreviations: AP, acute pancreatitis; Gd-DTPA, gadolinium-diethylenetriaminepentaacetic; Gd-NL, Gd-DTPA-loaded liposomes; M-Gd-NL, gadolinium-diethylenetriaminepentaacetic-loaded mannosylated liposomes; MRI, magnetic resonance imaging; ROIs, regions of interests; SNR, signal-to-noise ratio; T1WI, T1-weighted.

