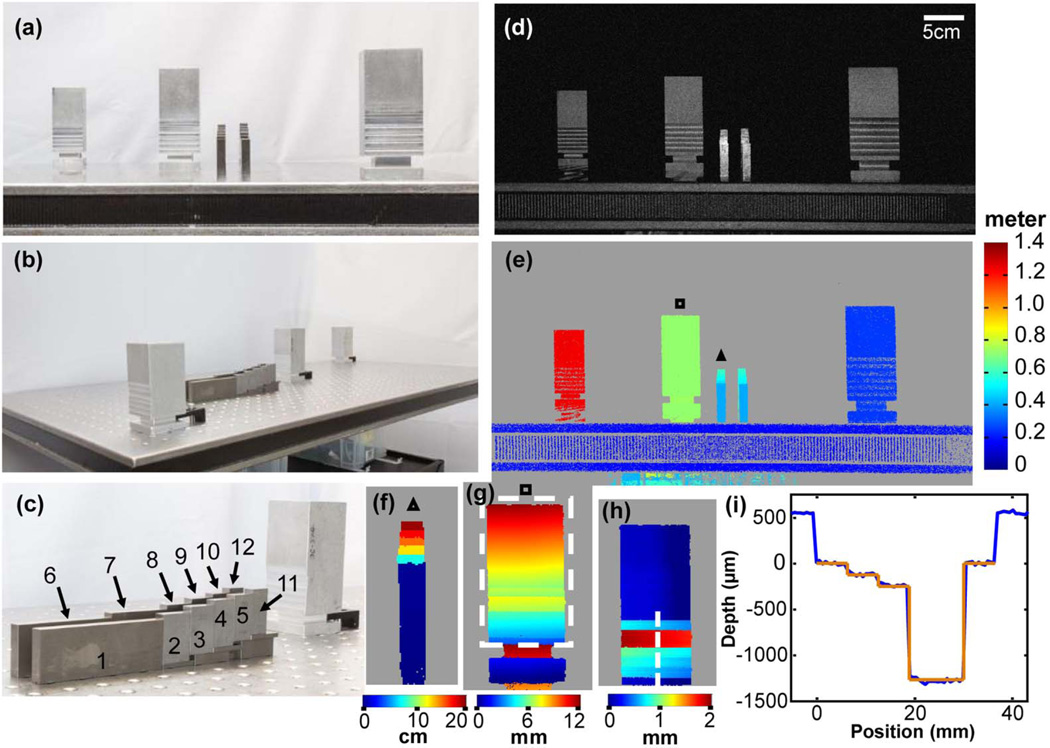
Fig. 4.
(a) and (b) Photographs of the aluminum posts and steel gauge blocks on an optics table from two perspectives. (c) Photograph of the gauge blocks. (d) OCT maximum intensity projection. The OCT volume has 500 × 1000 A-scans. The volume size is 0.288 m3 (d = 98 cm, l = 150 cm, θx = 20.4 deg, and θy = 9.7 deg). (e) Distance mapping of the objects in meter scale. (f) Distance mapping of the gauge blocks on a centimeter scale. (g) Visualization of the tilt of an aluminum post with respect to the incident OCT beam on a millimeter scale. (h) Topological mapping of the aluminum surface from the box in (g) after correcting for sample tilt. (i) Relative depths of milled steps in the aluminum post surface from dotted line in (h) on a micrometer scale showing good agreement between the OCT measured surface profile (blue) and nominal depths from the milling machine digital readout (orange). Depth scale was calibrated by measurement of gauge block 1, and the transverse scale was calibrated by the nominal milled widths.

