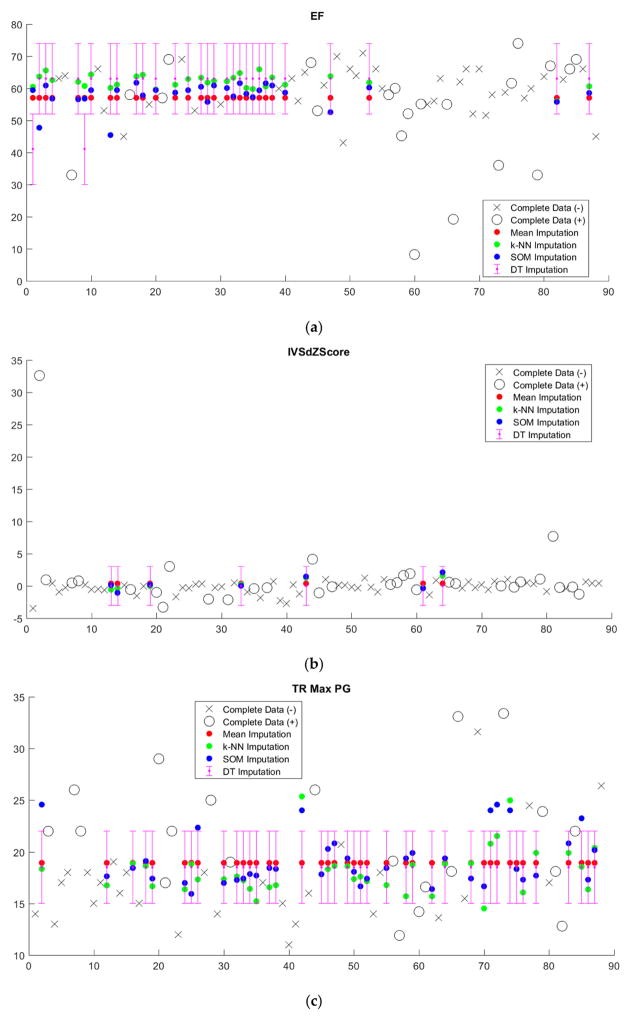
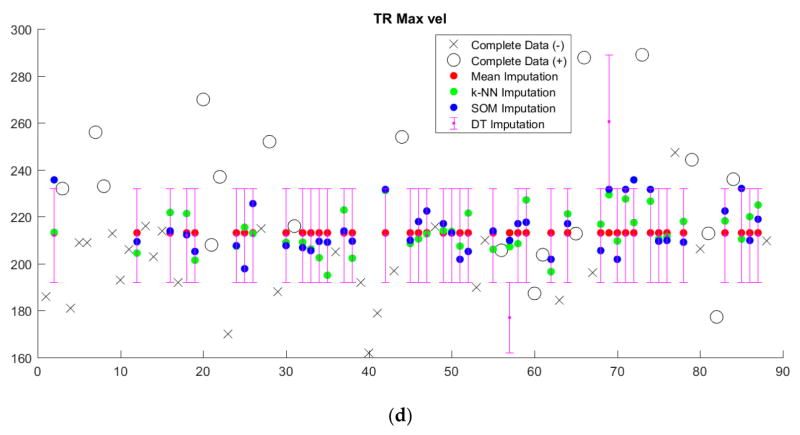
Figure 5.
Imputed values for four representative variables (a) ejection fraction (EF), (b) interventricular septum thickness z-score (IVSdZScore), (c) tricuspid regurgitation max pressure gradient (TR Max PG), and (d) tricuspid regurgitation max velocity (TR Max vel). Observed values for the positive class are shown as black circles and observed values for the negative class are shown as black X’s. Imputed values for mean, k-NN, and SOM imputation are shown as red, green, and blue dots, respectively. Because decision tree (DT) imputation requires discretized values, imputed values are reported as a discretized range.


