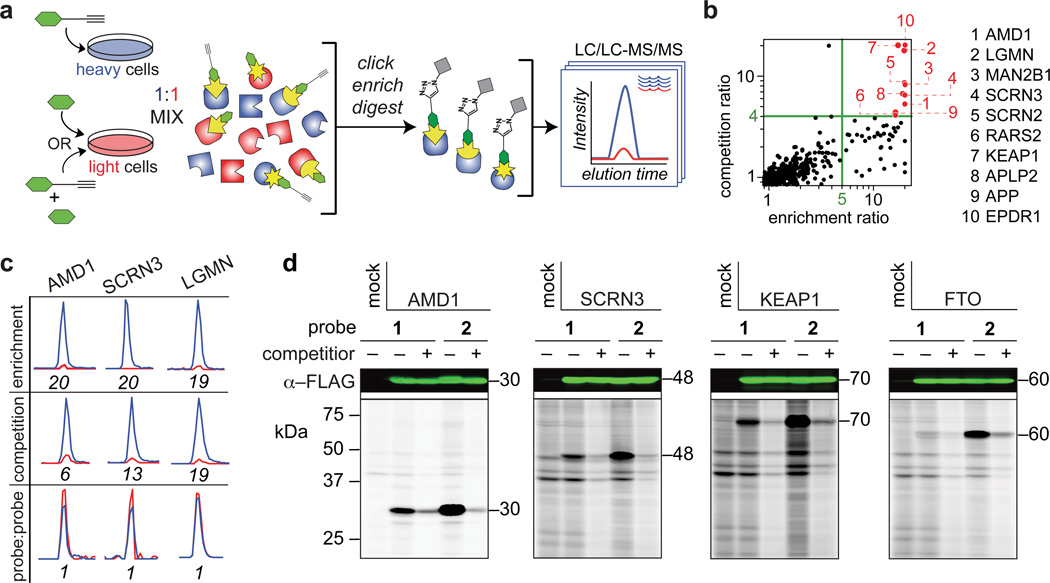
Fig 2. Identification of protein targets of hydrazine probes.
a, Schematic for MS-based quantitative (SILAC) proteomics experiments (enrichment and competition) as described in the text. Heavy (H) and light (L) cells, proteomes, and peptides are depicted in blue and red, respectively. b, Quadrant plot of average competition versus enrichment SILAC ratios from quantitative proteomics experiments (left). Probe-1 targeted proteins (upper right quadrant) are highlighted in red and listed to the right of the plot. c, Extracted parent ion chromatograms and corresponding H/L ratios for representative tryptic peptides of three protein targets of probe 1 quantified in enrichment, competition, and probe vs. probe control experiments. d, Western blots (upper) and RP-ABPP data (lower) for hydrazine probe-treated transfected cells expressing the indicated protein targets. The first lane in each panel corresponds to a control transfection (‘mock’) with the appropriate empty expression vector as described in Supplementary Methods. Molecular weights (kDa) are indicated.

