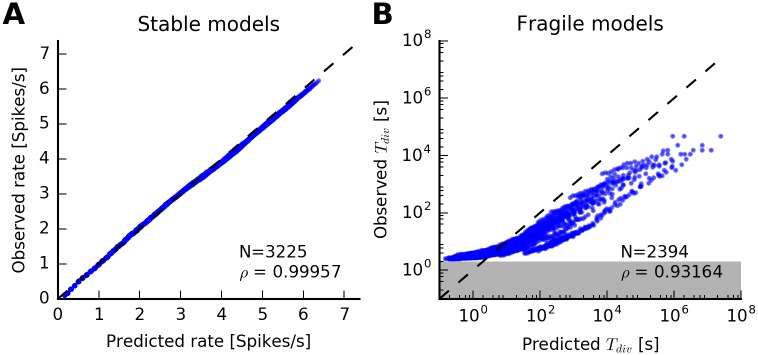
Fig 6. Rate and time to divergence: Exponential spike-history filter.
(A) Observed steady-state firing rate versus predicted steady-state firing rate for every model classified as “stable” in Fig 5. Each dot corresponds to a model. Dashed line indicates equality. Linear correlation coefficient is ρ = 0.9996. (B) Observed versus predicted divergence times for all models classified as “fragile” in Fig 5. Note the logarithmic axes. The QR approximation provides an approximation of the divergence times. The divergence time of a simulation was defined as the end of the first two-second interval in which the average rate exceeded λthr. Therefore, estimated divergence times cannot be below 2 s (gray area).

