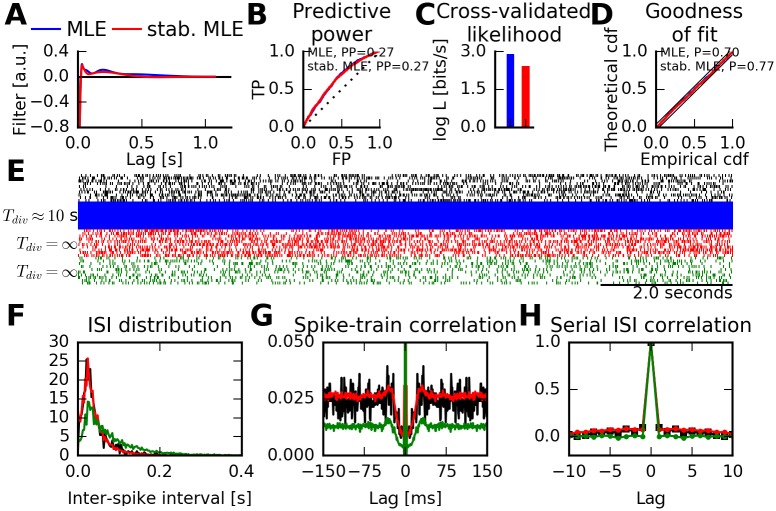
Fig 10. Neuron models can be stabilized with constrained maximum-likelihood estimation.
(A) Estimated spike-history kernels using maximum-likelihood estimation (blue) and the constrained (stabilized) maximum-likelihood estimation (red). Data are from single-unit activity (SUA) recordings from monkey cortical area PMv [31]. (B) Power of predicting spiking activity on test data for both the maximum-likelihood estimate (MLE) and the stabilized MLE. The receiver operating characteristic (ROC) curve is shown for predicting spikes in 1 ms time bins with false positive rate (FP, x-axis) and true positive rates (TP, y-axis). Diagonal line indicates chance-level prediction. Predictive power is defined as PP = 2 ⋅ AUC − 1 with AUC being the area under the curve. Perfect spike prediction corresponds to PP = 1. Both models predict spikes equally well. (C) Log-likelihood evaluated on test data. Both MLE and stabilized MLE models preserve information about spike times. Model log-likelihoods (in bits per second) are relative to a homogeneous Poisson process with the correct spiking rate. (D) Kolmogorov-Smirnov test of rescaled inter-spike intervals following the time-rescaling theorem. Both MLE and the stabilized MLE pass the goodness-of-fit test (P > 0.05). (E) Recorded spike trains and simulated spike trains from estimated models. Top: Randomly selected 10 s intervals of neural activity part of the training data (black). Simulating from the unconstrained MLE model (blue) leads to quickly diverging firing rates (Tdiv ≈ 10 s). Spiking activity from the stabilized MLE (red) remains finite and physiological. Simulating from the MLE with a reset condition after each spike (green, [34]) leads to non-divergent firing rates, but the firing rate of the training data is not matched. (F) Inter-spike interval statistics of real and simulated spiking activity for which rates were non-divergent. Same colors as in (D). The stabilized MLE qualitatively reproduces the training data ISI distribution. (G) Autocorrelation of recorded and simulated activity. (H) Serial ISI correlations of real and simulated spiking activity. The stabilized MLE accurately reproduces correlations in the training data. Simulating the MLE with a reset condition (green) leads to a renewal process, hence vanishing correlations at non-zero lags.

