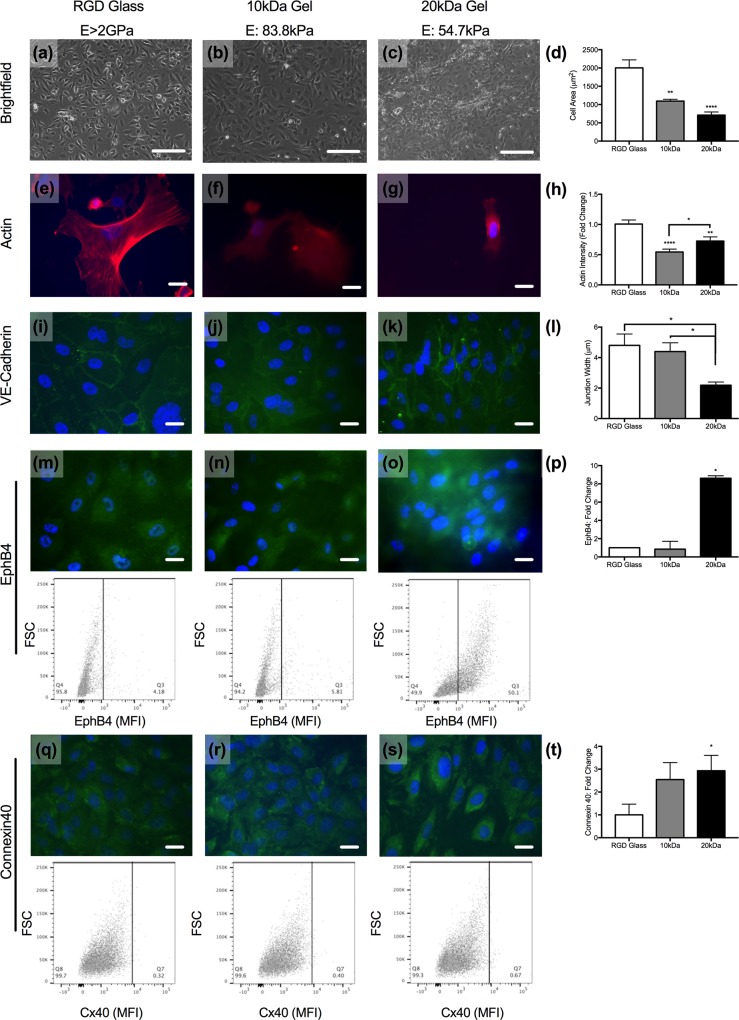
Fig 2. EC phenotype is modulated by substrate stiffness.
(a-c) Brightfield images of ECs cultured on RGD-coated glass (E>2GPa), 10kDa (E: 83.8kPa), or 20kDa (E: 54.7kPa) hydrogels. Scale bars are 80 microns. (d) Quantification of cell size across all three substrates. **p<0.01, ****p<0.0001 as determined by one-way ANOVA. (e-h) Phalloidin (red) and DAPI (blue) staining on sub-confluent ECs on glass (e), 10kDa (f), and 20kDa (g) gels and quantification of the actin intensity (h). *p<0.05, **p<0.01, ****p<0.0001 as determined by unpaired t-test. Intensity of 10kDa and 20kDa images augmented to increase staining visibility. (i-l) VE-cadherin (green) and DAPI (blue) staining on ECs on glass (i), 10kDa (j), and 20kDa (k) gels and quantification of the junctional width (l); *p<0.05 as determined by one-way ANOVA. (m-o) EphB4 (green) and DAPI (blue) staining on ECs on glass (m), 10kDa (n), and 20kDa (o) gels with representative flow cytometry dot plots shown below each image. Quantification of the intensity of expression (p); *p<0.05 as determined by unpaired t-test. (q-s) Connexin40 (green) and DAPI (blue) staining on ECs on glass (q), 10kDa (r), and 20kDa (s) gels with representative flow cytometry dot plots shown below each image. Quantification of the stain intensity by flow cytometry; *p<0.05 by unpaired t-test (t). Scale bars in (e-s) are ten microns.

