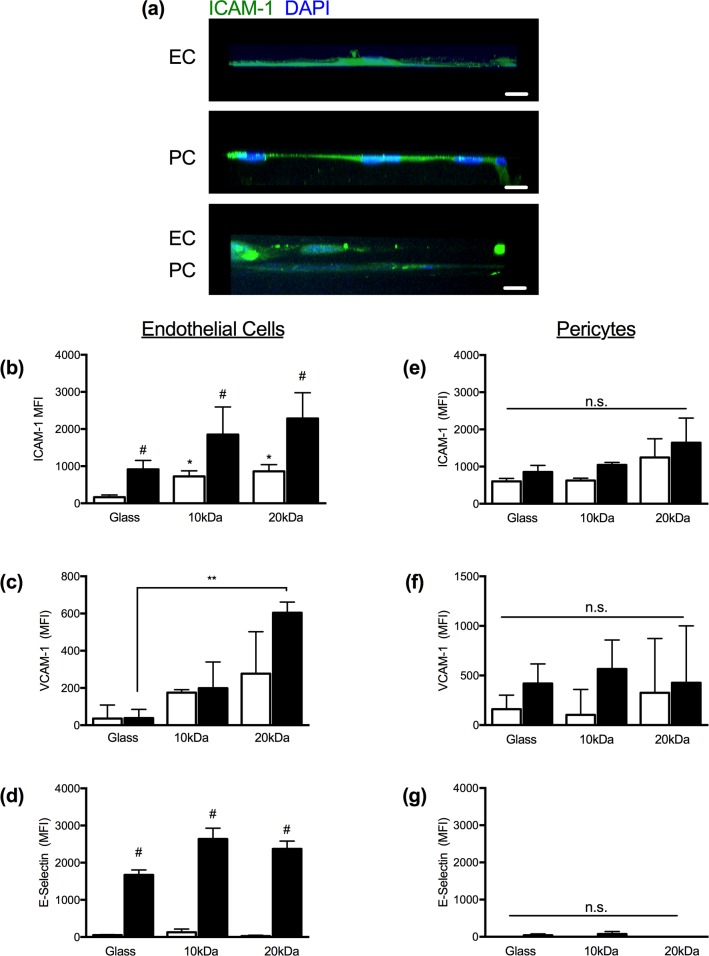
Fig 4. Vascular cell response to TNFα-activation on porated PEG gels.
(a) EC (top), PC (middle) and EC/PC (bottom) cell layers in profile stained for ICAM-1 (green) and DAPI (blue) on 20kDa gels. Scale bars are ten microns. (b-d) Flow cytometry results of ECs stained for ICAM-1 (b), VCAM-1 (c), and E-selectin (d) under control and TNFα-activated conditions on RGD-coated glass (E>2GPa), 10kDa (E: 83.8kPa), or 20kDa (E: 54.7kPa) hydrogels. (e-g) Flow cytometry of PCs stained for ICAM-1 (b), VCAM-1 (c), and E-selectin (d) under control and TNFα-activated conditions on RGD-coated glass (E>2GPa), 10kDa (E: 83.8kPa), or 20kDa (E: 54.7kPa) hydrogels.

