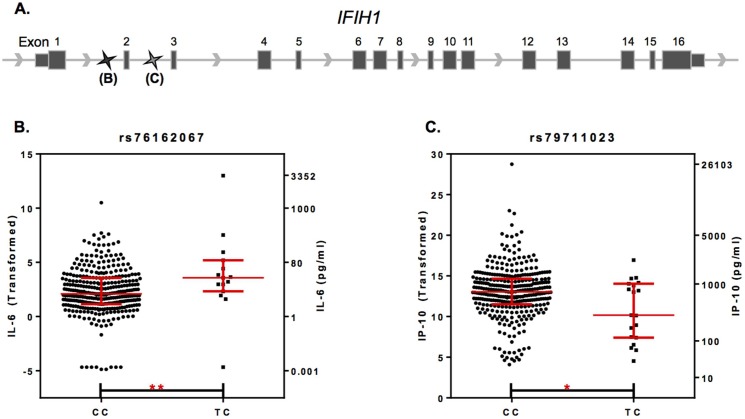
Fig 2. IFIH1 effect on plasma levels of IL-6 and IP-10.
Exon map of IFIH1 is presented (A) containing labeled SNPs rs76162067 and rs79711023. IL-6 (B) and IP-10 (C) levels in study participants expressing the major (CC) or minor (CT) allele of SNP rs76162067 or rs79711023, respectively, are expressed as box-cox transformed (left y-axis) and concentration (right y-axis) values. Exon order is displayed L-R for ease of interpretation, although IFIH1 is transcribed R-L from the negative strand. Data in B-C are presented as median ± interquartile range. *p≤0.05, **p<0.01 Mann-Whitney test.

