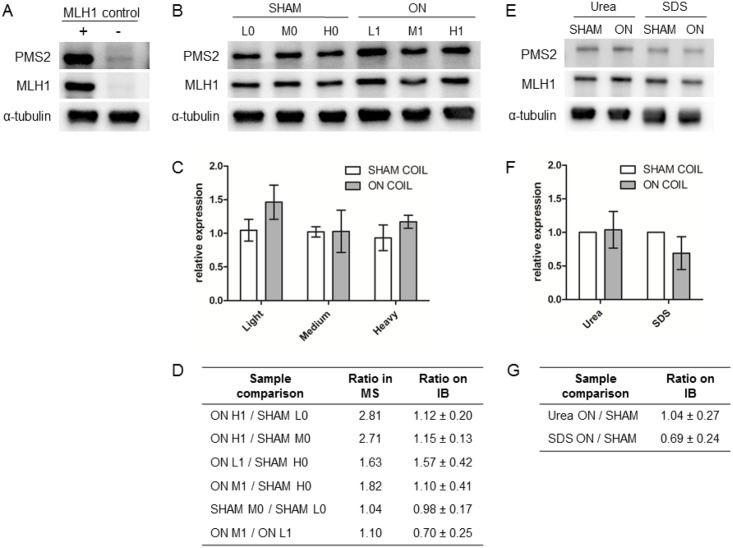
Fig 5. Quantitative immunoblot analysis of MLH1 expression in the VH10 cell line upon ELF exposure.
(A) Immunoblot of control cell line HEK293T-Lα [25] in which expression of DNA mismatch repair protein MLH1 and its binding partner PMS2 is regulated by doxycycline. The presence (+) and absence (-) of doxycycline is indicated. (B) Immunoblot of extracts from untreated (SHAM) and exposed (ON) VH10 cells labeled with different isotopes (L, M and H) and used for semi-quantitative mass-spectrometry analysis. Proteins were visualized using antibodies against MLH1, its binding partner PMS2, and α-tubulin as loading control. (C) Relative MLH1 expression levels (mean ± SD) in extracts from untreated and exposed cells as determined from 6 immunoblot replicas of the MS samples. (D) Tabulated ratios for relative MLH1 expression levels in differentially labeled VH10 cells as determined by mass spectrometry (MS) and immunoblot (IB) analyses. (E) Immunoblot of VH10 cells, lysed using either urea or SDS, obtained from an independent exposure. (F) Relative MLH1 expression levels (mean ± SD) in extracts from an independent exposure as determined from 9 immunoblot replicas. (G) Tabulated ratios for relative MLH1 expression levels based on immunoblot analysis of extracts from the independent exposure.

