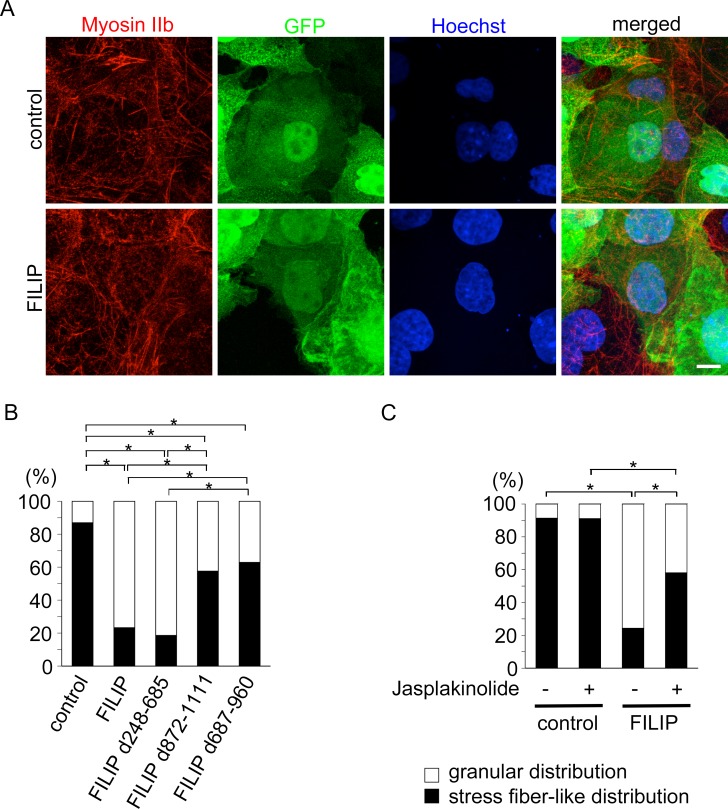
Fig 3. Exogenous expression of FILIP influences the subcellular distribution of non-muscle myosin IIb.
(A) Non-muscle myosin IIb was visualized (red) using an anti-NMHCIIb antibody in COS-7 cells. Green, bicistronic GFP expression vector for FILIP; blue, cell nuclei labeled with Hoescht dye. Scale bar = 10 μm. (B) The graph shows the ratio of the cells exhibiting a stress fiber-like distribution of non-muscle myosin IIb. The numbers of cells containing stress fiber-like distributions of non-muscle myosin IIb/total cells were: 287/330 control cells, 74/318 FILIP-expressing cells, 58/312 FILIP d248-685-expressing cells, 186/323 FILIP d872-1111-expressing cells, and 195/310 FILIP d687-960-expressing cells. *p < 0.01 (Fisher’s exact test) (C) The graph shows the effects of jasplakinolide. The numbers of cells containing a stress fiber-like distribution of non-muscle myosin IIb/total cells were: 285/312 control cells treated with vehicle, 286/314 control cells treated with jasplakinolide, 76/313 FILIP-expressing cells treated with vehicle, and 180/310 FILIP-expressing cells treated with jasplakinolide. *p < 0.01 (Fisher’s exact test).

