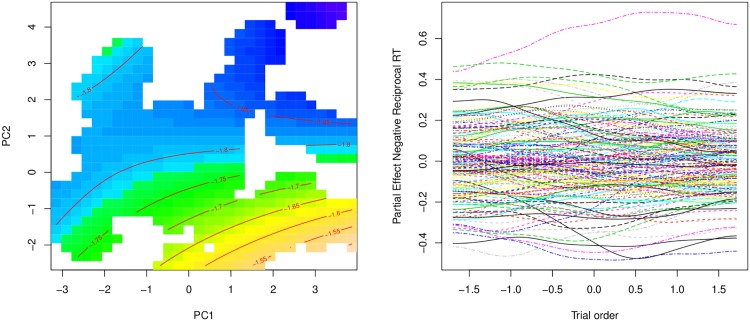
Fig 7. Nonlinear effects in experiments 1a and 1b.
Left panel: tensor product smooth for the nonlinear interaction of the principal component for neighborhood similarity structure (pc1) and frequency of occurrence (pc2) in Experiment 1. Darker colors indicate shorter response latencies. Right panel: Partial effect of the by-participant random smooths for Trial. Each curve represents a different participant.

