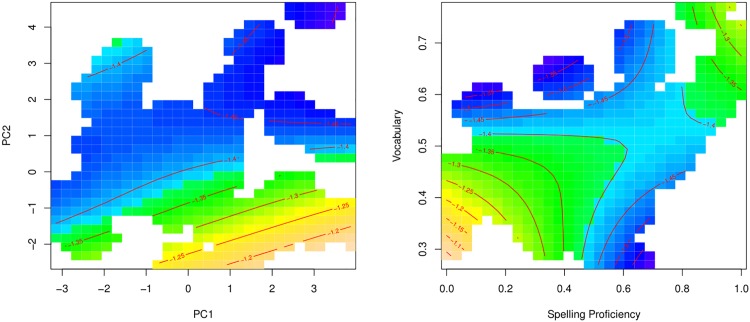
Fig 9. Tensor product regression smooths for experiments 2, classical lexical-distributional predictors.
Left panel: tensor product smooth for the nonlinear interaction of the principal component for neighborhood similarity structure (pc1) and frequency of occurrence (pc2). Darker colors indicate shorter response latencies. Right panel: tensor product smooth for the nonlinear interaction of individual differences in spelling proficiency and vocabulary.

