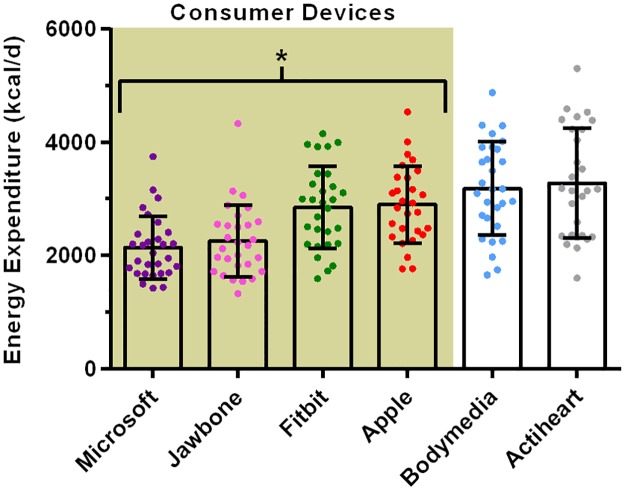
Fig 3. Estimated 24 hr energy expenditure from the wearable devices.
Data is depicted as mean, with individual data points shown and error bars representing the SD. * Denotes that all consumer devices were significantly different p < 0.01 from the research devices. Each individual device is significantly different p < 0.01 from every other device, except for the comparisons between Microsoft vs. Jawbone, Fitbit vs. Apple and Bodymedia vs. Actiheart.

