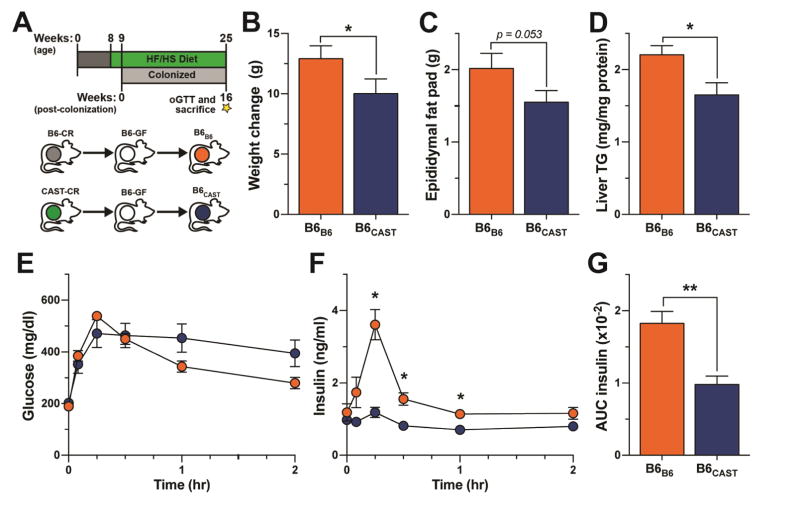
Figure 3. Divergent effects of B6 and CAST microbiomes on diet-induced metabolic phenotypes.
(A) Transplant experimental design. (B) Total weight change, (C) epididymal fat pad mass and (D) quantification of hepatic triglyceride (TG) contents. (E and F) Glucose and insulin values during oGTT and (G) AUC insulin in B6B6 and B6CAST mice. All measurements shown collected 16-weeks post-colonization. *p < 0.05, **p < 0.01 by Student’s t-test. Data are mean ± SEM, n = 7 for B6B6 and n = 6 for B6CAST mice.

