Figure 2.

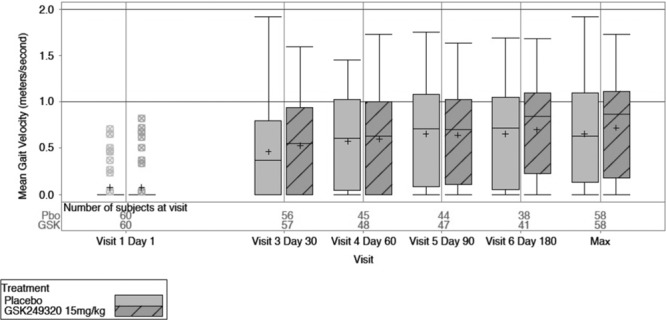
Box-and-whisker plots of gait velocity change over time and maximum value for the 2 treatment arms (intent-to-treat group).

Box-and-whisker plots of gait velocity change over time and maximum value for the 2 treatment arms (intent-to-treat group).