
Figure 2.
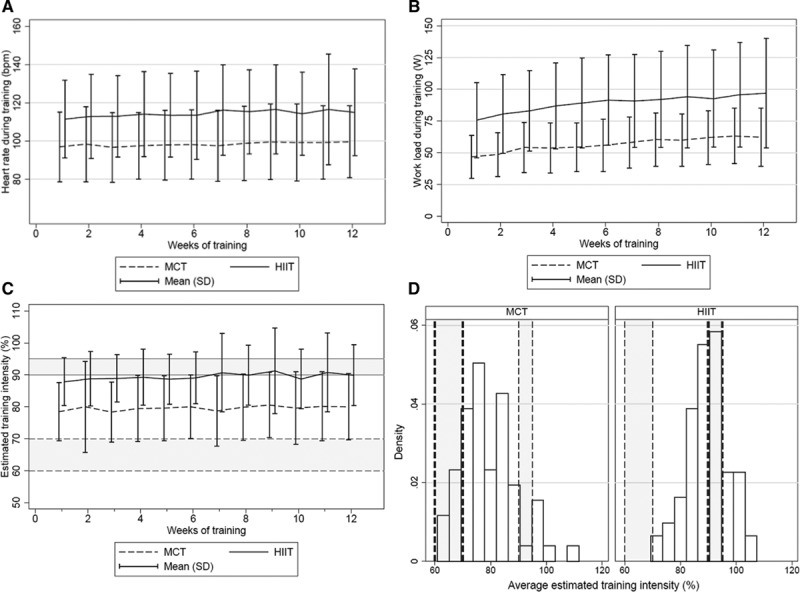
Training intensity during the 12-week intervention. A, Heart rate during training. Average heart rate during the 12-week intervention, estimated as weekly mean (SD) during moderate continuous training (MCT) and during the last 2 minutes of high-intensity interval training (HIIT). Constant difference between groups: 16 bpm (10–22 bpm; P<0.001). B, Workload. Average workload estimated as for heart rate. Difference between groups: 33 W (24–42 W; P<0.001). C, Training intensity. Average relative training intensity (percentage of maximal heart rate) estimated as for heart rate: HIIT, 90% (88%–92%); MCT, 77% (74%–82%); difference, 10% (8%–13%; P<0.001). Some of the variability in estimated training intensity probably results from variation in maximal heart rate. Comparing baseline and follow-up assessments in individual patients revealed differences that seemed randomly distributed and independent of intervention group, center, and whether the patients had sinus rhythm or atrial fibrillation (data not shown). Shaded areas mark boundaries of prescribed training intensity: HIIT, 90% to 95%; MCT, 60% to 70%. D, Training intensity on target. Distribution of average training intensity during the 12-week intervention; MCT, left histogram; HIIT, right histogram. Shaded areas mark boundaries for prescribed training intensity. Fifty-one percent of HIIT patients exercised below their prescribed training intensity, and 80% of MCT patients exercised above theirs. Density scales the height of the bars so that the sum of their areas equals 1.00.