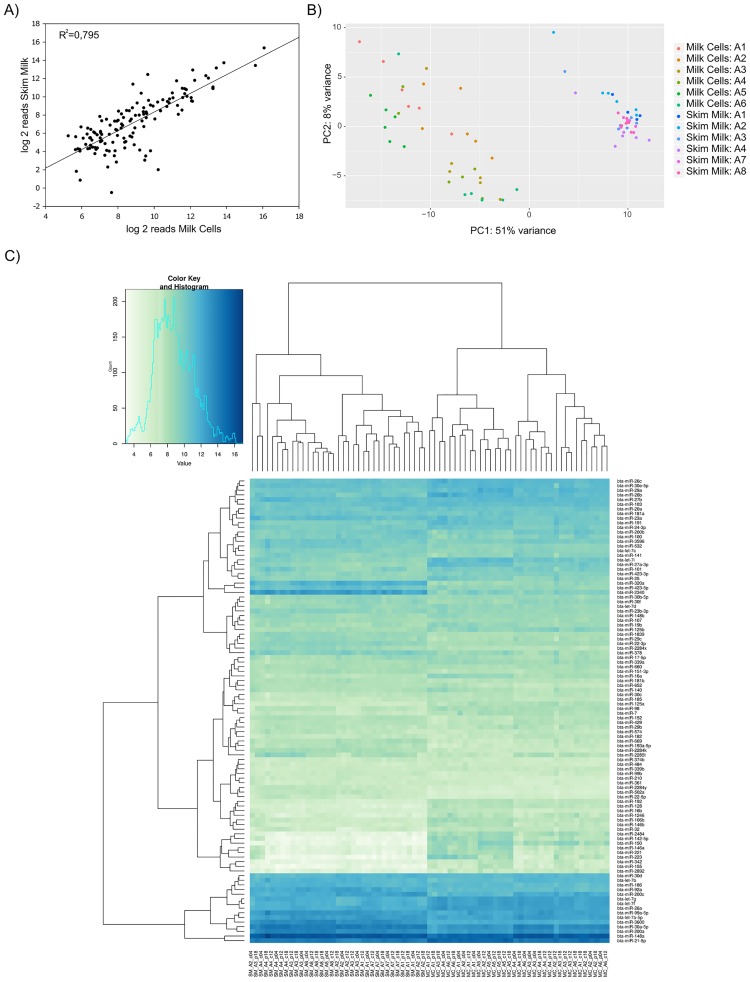
Fig 2. Comparison of MC and SM miRNA profile.
A) Correlation between miRNA mean values of all MC and SM NGS reads. Normalized NGS reads were used for calculation of Pearson Correlation Coefficient B) Heatmap of the top 100 miRNAs. Data was normalized, rld transformed and clustered using DESeq2 C) PCA showing MC and SM specific clustering. Clustering was performed using DESeq2.

