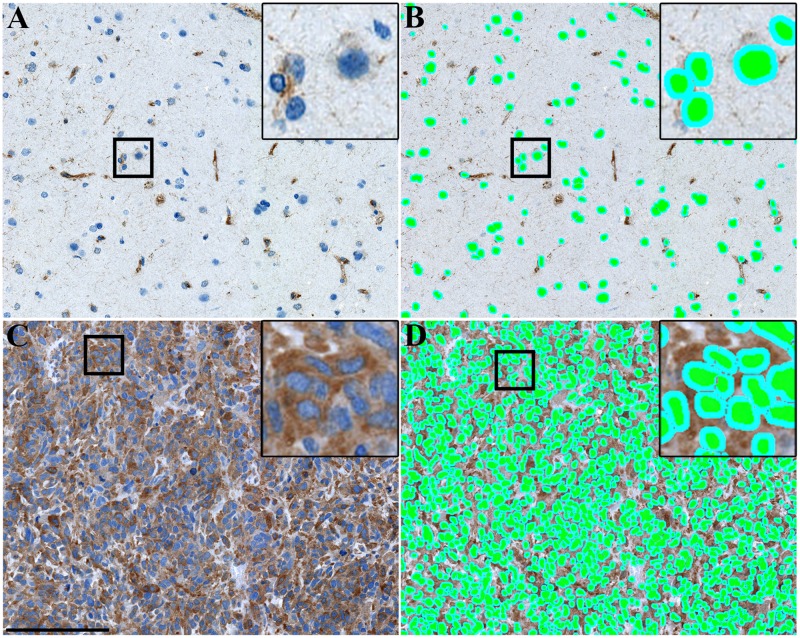
Fig 1. MMP-2 quantification using advanced software-based digital image analysis.
Image analysis was performed using a pixel classifier based on Bayesian classification. The classifier was trained to identify nuclei (green color) and measure MMP-2 intensity in a three μm perimeter around the nuclei (turquoise color). (A) In normal brain tissue, mainly cells located in and/or around blood vessels showed MMP-2 immunopositivity. (B) The software classifier easily identified all cells for measurement of mean MMP-2 intensity. (C) In some GBMs, most tumor cells had intense MMP-2 staining. (D) Even in densely stained tumors, the software classifier successfully identified all cells for quantification of mean MMP-2 intensity. Scale bar 150 μm.

