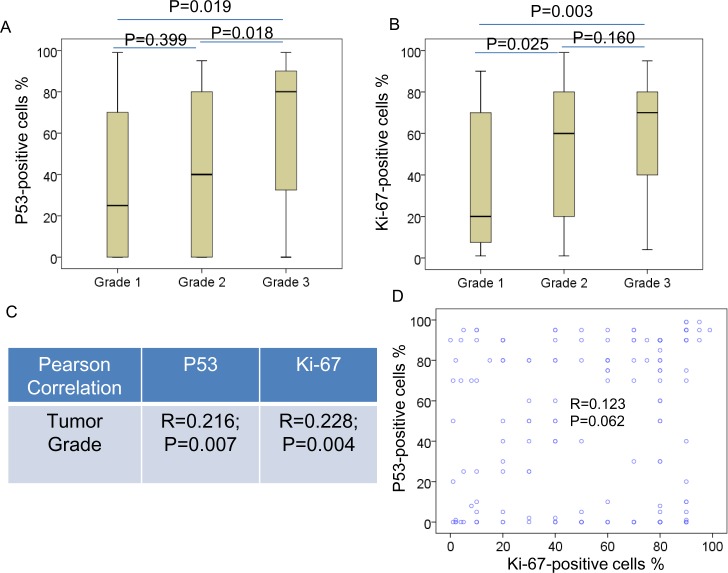
Fig 3. P53 and Ki-67 associates with tumor grade in TNBC.
Box plots indicating the distribution of the p53 (A) and Ki-67 (B) and tumor grade, P values were from one-way ANOVA and LSD tests. (C) P53 and Ki-67 was associated with tumor grade in TNBC. (D) P53 was associated with Ki-67 in TNBC. The R and P values were from Pearson Correlation.

