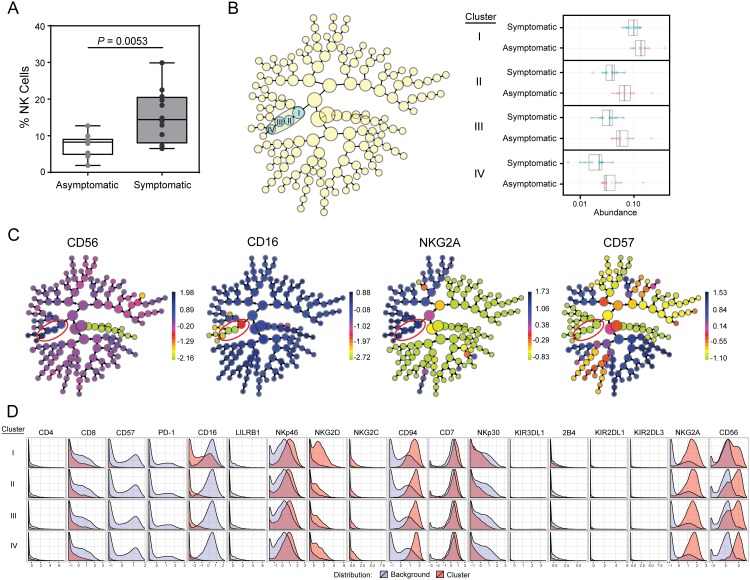
Fig 6. Decreased frequency of immature NK cells in subjects with a history of symptomatic WNV infection.
(A) Frequency of total NK cells in asymptomatic (n = 10) and symptomatic (n = 12) WNV subjects. (B-D) The NK dataset from asymptomatic and symptomatic subjects was analyzed by automated hierarchical clustering. Distinguishing clusters between the two groups were identified using SAM model (q < 0.01). (B) Stratifying clusters (yellow circles) including distinguishing clusters between the two groups (blue circles) and abundance of cells within the identified distinguishing clusters. (C) Expression of CD56, CD16, NKG2A and CD57 of stratifying clusters. (D) Histograms to characterize cluster features, with red outline indicating the expression pattern in the cluster that differed between groups and the blue outline indicating the level of staining in the population as a whole.

