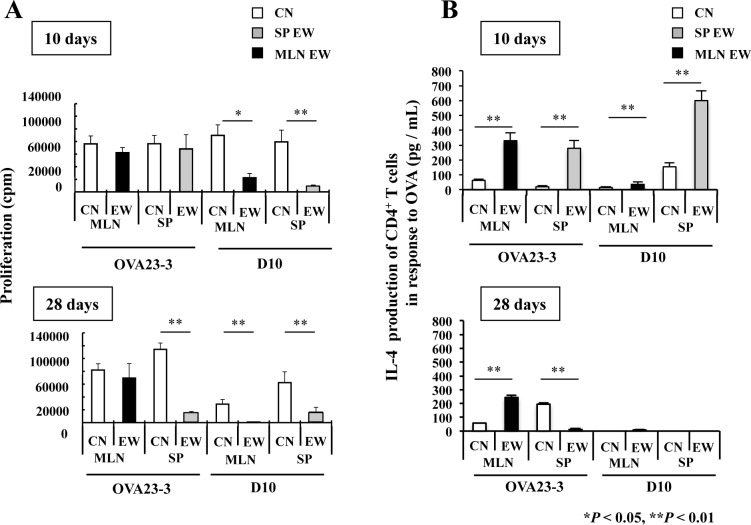
Fig 3. Responses of systemic or intestinal OVA-specific CD4+ T cells from EW-fed OVA23-3 and D10 mice.
Proliferation and IL-4 production of OVA-specific CD4+ T cells purified from spleen (SP) or mesenteric lymph nodes (MLNs) of control-diet-fed (CN, n = 3) or EW-fed (n = 2 or 3) OVA23-3 or D10 mice (n = 3 or 4). A, Proliferation of OVA-specific CD4+ T cells on day 10 (upper panel) and day 28 (lower panel) of EW diet. B, IL-4 production of OVA-specific CD4+ T cells on day 10 (upper panel) and day 28 (lower panel) of EW diet. The CD4+ T-cell responses from the MLN (black bars) and spleen (SP; gray bars) of EW-fed mice and control-diet-fed mice (white bars) are shown. These results are representative of three independent experiments; *, P < 0.05; **, P < 0.01.

