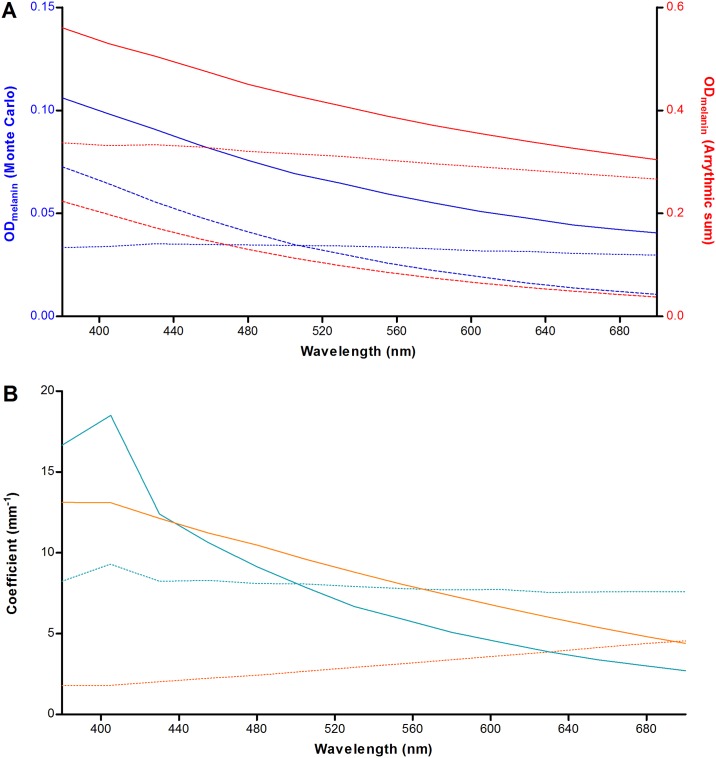
Fig 4. Relative contributions of light scattering and absorption by RPE-melanin.
(A) Agreement between Monte-Carlo simulation and theory, plotted based on conditions in the paramacular RPE of a healthy 20-year old person. The optical density (OD) was calculated based on the product of the attenuation coefficient and the melanosome layer thickness (lmelanin). Attenuation by absorption (striped line), scattering (dotted line), and total attenuation (straight line) are plotted separately. The MC results are shown in blue (left Y-axis) and the theoretical result is shown in red (right Y-axis). See text for details. (B) Simulations of a thin (3 μm; blue) and thick (52.5 μm; orange) layer of melanosomes. In case of thicker layers, there is a dominance of the absorption coefficient (μa, melanin, straight lines) over the backscattering coefficient (μ′s, melanin, striped lines) for all tested wavelengths.

